Our Favorite Supply Chain Analytics Tools
We all love Excel, and for most of us it's one of our go-to supply chain analytics tools. Many of us have used it to analyze our supply chains and to share insights and analytics with upper management. If your business currently uses Excel as one of its supply chain analytics tools and you’re running into a ceiling with what you can do – whether that means spending too much time maintaining your spreadsheets or your limited to the types of analysis that you can perform in a spreadsheet this article will show you how to break through that ceiling.
If you want to plan your next step in supply chain management, make data-driven strategic decisions, and gain confidence that your recommendations will make impactful improvements to your customers and the business this is the article for you.
The Step from Spreadsheets to Agile End-To-End Analytics Tools
I’ve been working in various supply chain roles for the last 17 years. Over that time I've used Excel to solve a myriad of problems like creating an MRP (Material Resource Planning) tool from scratch, optimizing to find the center of gravity for DC locations and break-even points in logistical service, performed transportation optimization for fulfillment, and built simulations. You can do a lot with Excel and anyone can easily collaborate with others because everyone has Excel and most have a good understanding on how to use it.
As great of a tool as Excel is it's not built for complex supply chains, so there are limitations. Those limitations translate to wasted time updating spreadsheets and making decisions based off models with questionable accuracy. Ultimately, the limitations in Excel translate to lost time and money. In this article, I will show how anyLogistix can help you push through these Excel Limitations. When you use anyLogistix in your supply chain, you'll have an agile, end-to-end supply chain analytics tool to tackle problems that go far beyond the limitations of Excel.
How To Know Your Team Is Limited By Their Work In Excel
So people in most companies (big and small) will mention the above reasons on why they use excel and want to keep on using it. There is nothing wrong with that. But eventually companies run into limitations with excel because it’s not built for modeling real-world supply chains. How do you know if you’re hitting the limitations of excel?
- If you’re using a spreadsheet for planning, and every “what-if” question requires days of rework
- If you’re using a spreadsheet for strategic decisions that require optimization, and every change requires days of rework
- If your supply chain is increasing in complexity and you aren’t confident that you spreadsheet captures that complexity
- If you’re analysis in excel doesn’t answer important questions like what our service level will be over time
If you need a way to answer questions like this without spending weeks in a spreadsheet, this blog will help you save time and money through optimization and simulation with anyLogistix.
Supply Chain Analytics Tools At A Glance
- Excel
The purpose of Excel is to manipulate, clean data and analyze. It’s not dynamic or holistic. It does not provide visibility into performance. Since you cannot capture the complexity of a supply chain in Excel, accuracy is questionable. Some optimization can be used with its solver, but you need to create new models every single time which takes time. Simulation in Excel is limited.
2. anyLogistix
The purpose of anyLogistix is to capture the complexity of a supply chain in a model and help the user analyze the supply chain with different experiments. anyLogistix combines optimization and simulation. Optimization helps to find the best way to configure a network and simulation helps to determine how it will perform over time. anyLogistix is dynamic and agile because its simulation engine takes into account variability in the process, resources constraints (people, trucks, machines, etc, and risks over time. This helps to understand dependencies in the supply chain. Finally, anyLogistix animates the supply chain over a GIS map which helps with analysis and discussing options with other stakeholders.
Click here to learn how to compare supply chain scenarios with anyLogistix.
3. Excel vs anyLogistix for Supply Chain Analytics
Let me run through what typically happens in medium to large companies using a simple waterfall model methodology. Whether you implement a new idea or modify a current process/opportunity with a spreadsheet it will go through the following steps:
- Gather, clean, and analyze the data using something like excel to quantify the opportunity
- If the opportunity requires investment (resources, time, and money), then a business case will be created
- Stakeholders will review the business case and make a decision
- Project Charter will be created
- Capture the current and future process with a Visio or a diagram/process software
- Create a BRE (business requirement document) to gather business requirements
- Design the simulation, gather design specs (non-functional and reporting requirements). Can also be found within a BRE or a design spec document.
- Stakeholders will approve the requirements and the implementation
- Implementation plan will be executed and completed
- The new process will be managed and controlled
We use AnyLogistix for supply chain analytics because it improves this process. Here's the process in these projects.
- Gather, clean, analyze and format the data for ALX using something like excel
- Build the current supply chain baseline
- Create a BRE, gather objective, vision and requirements from management and stakeholders.
- Design the ALX model and share the results (Use a compare from baseline to new model) like in a business case to get it approved.
- Run a kickoff meeting (1-2-page Project Charter may prove useful) to understand the level of effort, cost, and implementation plan to make it happen and make sure the design and results are aligned.
- Stakeholders will approve the requirements and the implementation with confidence
- Implementation plan will be executed and completed
- The new process will be managed and controlled
In the first process using a spreadsheet, you need to prove the ROI just to move forward with analyzing one scenario because of the time investment to do the analysis. This becomes time consuming because every new what-if question means more time. It is inefficient. The process with anyLogistix is easier and faster. ALX captures the complexity of a supply chain and makes it easy to analyze multiple “what if” scenarios. It also makes your team more agile because every new what-if question and requirement can be done with a few clicks. ALX isn’t just more efficient, it is more effective because it includes animation, structure view, and a diagram of the process (See Images below) out of the box.
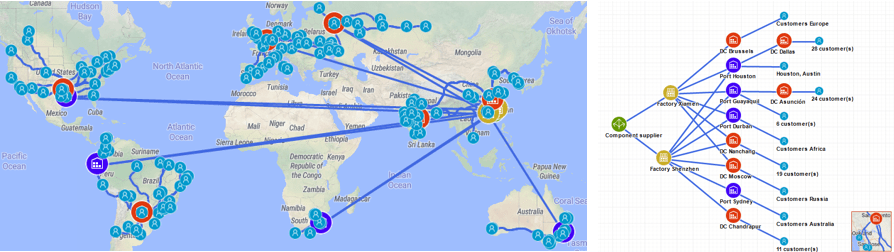 Supply Chain Network Diagram in anyLogistix. Download at www.anylogistix.com
The Challenge With Data
Gathering and cleaning the data is the biggest challenge, whether you’re using a spreadsheet or anyLogistix. In spreadsheets, there are minimal shortcuts but with anyLogistix you can reduce the time spent by automating data tables and simply importing a current snapshot of your supply chain when starting a new project. With this, you are on your way to creating a digital twin of your supply chain.
Outputs of Excel vs anyLogistix
Dashboards in a spreadsheet are limited by what you can show and the type of analysis you are performing in Excel. Since you can’t capture the dynamic supply chain process with variability and resource constraints over time, you can’t show key metrics like service level, resource utilization, and an accurate Profit & Loss Statement. ALX has over 113 stats you can use in your dashboard from table, bar chart, line chart, histogram chart, and other types to compare analysis of complex scenarios captured when you build a model in anyLogistix.
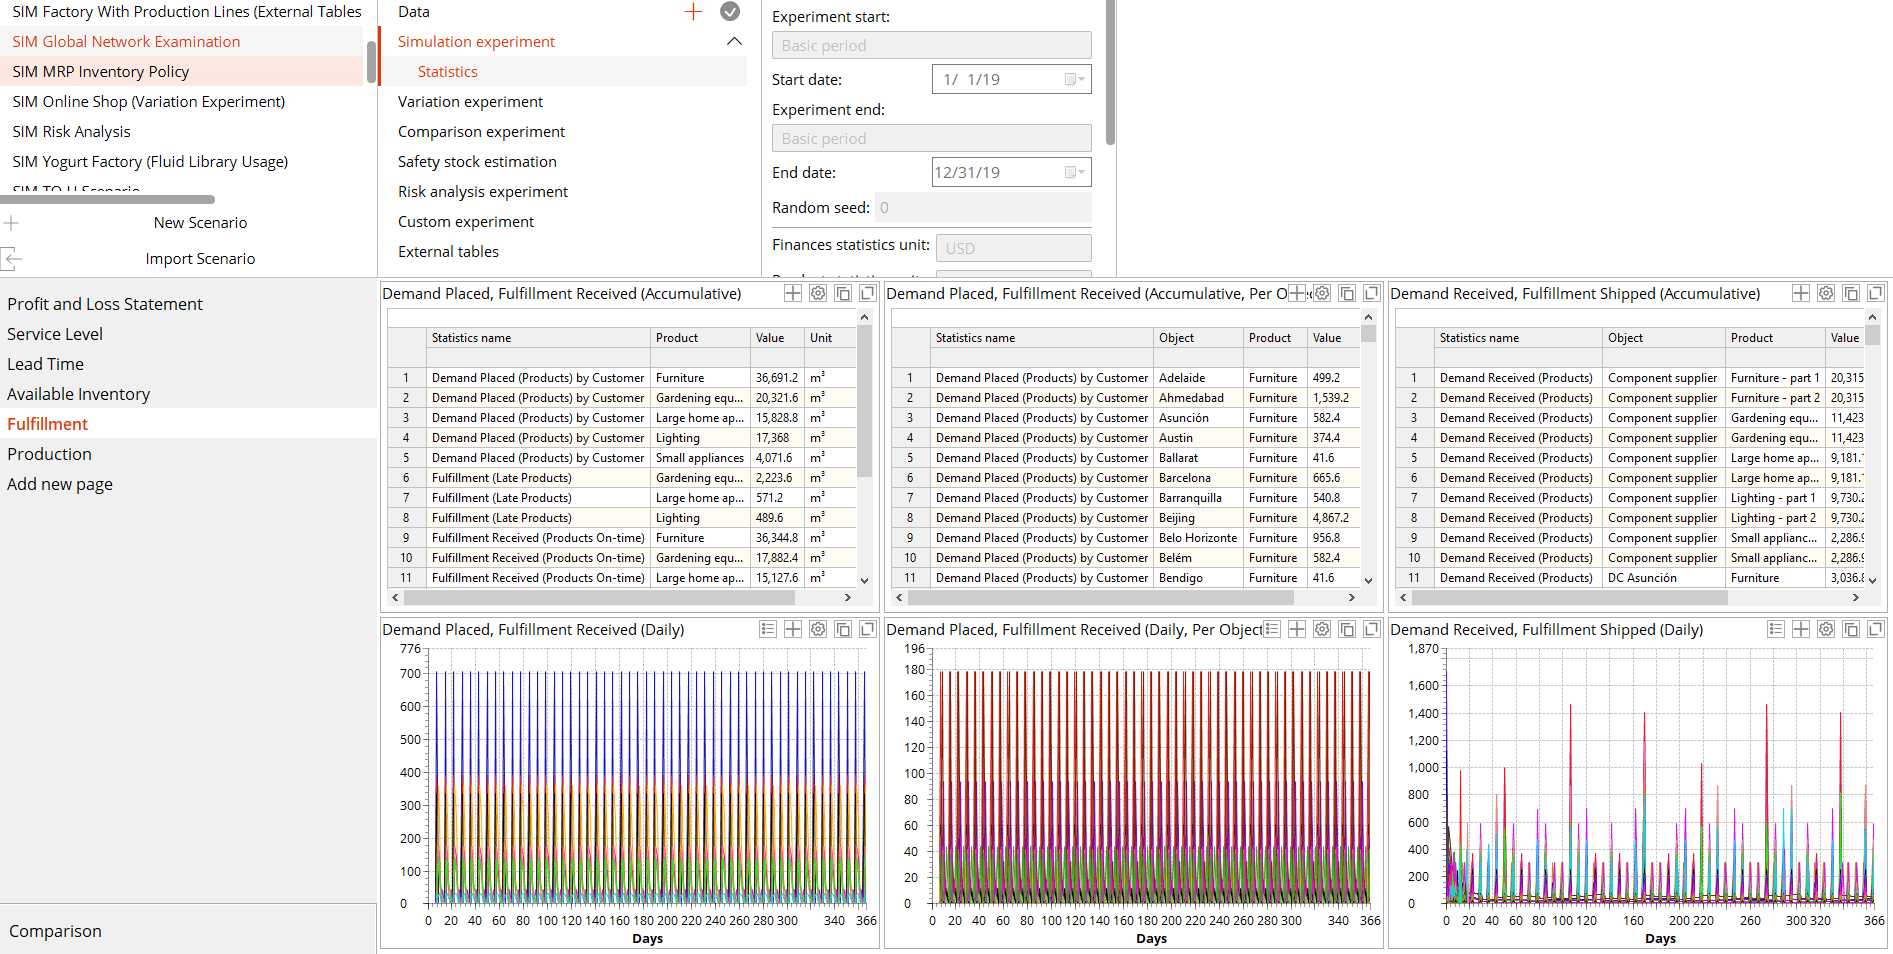 Supply Chain Analytics Outputs with anyLogistix
Excel vs AnyLogistix – A Detailed Comparison of Supply Chain Analytics Tools
Excel
Pro’s
- Readily available in any organization
- Can be easily shared with others
- Can be used to work data sets
- Can be used for general analytical analysis
- Can use an add-in such as solver for some analytical optimization, risk, and variation experiment
Con’s
- Solver requires spreadsheet modeling background and/or training
- Solver requires an investment of $4-5K per year license
- Will not consider detail-oriented analysis on results tied to supply chain methodology (Speed, Cost, Quality)
- Understanding Tradeoffs, risk, bottlenecks, etc.
- Spreadsheet rely on a lot of assumptions
- Spreadsheets are prone to human error
- Not able to use variability, only able to use a single value
- Not able to use time variability that you see in many processes
- Not able to capture or provide risks, issues, and bottlenecks
- Not able to mitigate or prescribe opportunities to reduce or solve those issues
- Will not consider the system process for resource in terms of work
- Will not include the animation
- Will not take into consideration dependencies such as different times or products that take different steps causing non-accurate levels in your analysis.
ALX (AnyLogistix) - Supply Chain Analytics Tools for Design Simulation Software
Pro’s
- Can be easily shared with others
- Built specifically for supply chain analytics
- Components included:
- Greenfield Analysis
- Network Optimization
- Simulation
- Transportation Optimization
- Simulation includes the following sub-components:
- Safety Stock / Inventory Optimization
- Scenario Comparison
- Risk Analysis
- Variation Experiments
- Supply Chain Methodology:
- Policies in Inventory, transportation and sourcing are available and can be modified
- Automate Lats and Longs
- Provides prescribed solutions in network, transportation, and inventory optimization
- Perform Predictive Analytics with Simulation
- Will provide detail-oriented analysis on results tied to supply chain methodology (Speed, Cost, Quality)
- Understand Tradeoffs, risk, bottlenecks, etc.
- Provides supply chain analytical analysis (113 stats available) for easy implementation
- Stakeholder buy-in is shorter and confidence higher
- Scenario comparison (from the current baseline to future process) for decision making
- Facilitate decision making and scenario analysis
- Improves accuracy in your results
- Build What-if scenarios
- Animate The Supply Chain
- Can help in underlying concepts
- Track individual process from beginning to end
- Understand what happens at a current state and helps them evaluate that moment
- Improved insight and how the future system will look like.
- Significant impact than presenting table of data and charts.
- Data -riven (Not designer-driven) – User friendly and easy to learn
- GUI interface and table can be used to modify, sort, and filter data
- Conversion capabilities available to convert results and scenarios from one scenario to another
- Process improvement analysis
- Takes variability into account for real-world accuracy
- Considers dependencies such as different times or products that take different steps.
- Accurate level of accuracy and capability in your analysis
- Allows for better communication of changes within the organization
- Create stakeholder buy-in along every step of the project
- Build a Digital Twin
- Leader and most advanced simulation engine available in the market (20+ years)
Con’s
- Need to invest per license, although pricing is reasonable. Click here for pricing.
- Training required. 4 Day Virtual Class Available and Private Classes as well
- Will need a data manipulating tool such as Excel or a data base management software like Alteryx to query and import the data to ALX required data format
Conclusion
Through my experience in modeling in supply chain analytics tools including Excel and AnyLogistix, I was able to identify the key benefits in using ALX (AnyLogistix) as:
- Proven to be a competitive advantage
- Saves time, effort, and money in evaluating implementations in a risk-free environment
- Provides the capability to make business strategy decisions, manage the supply chain, and provide tactical solutions effectively and efficiently
- Improves and effectively manage stakeholder buy-in
- Creates digitizing your supply chain
- Aligns to business initiatives in Customer Service level and expectations
AnyLogistix and excel are powerful supply chain analytics tools. Excel has facilitated the use of ALX as it allows organizations to gather, analyze, and format the data necessary for ALX to import and design accordingly. Due to this cooperation between tools it has allowed users to easily bridge from spreadsheets to simulation creating a stronger bond and success in future users to come.
About Us
SimWell is the distribution partner for AnyLogistix in North America and a leader in simulation and optimization solutions. If you're looking for supply chain analytics tools that help you make better decisions, faster we can help.
It starts with a conversation. Send us a live chat, or click Start the Conversation in the top right. We want to learn about your supply chain challenges and see how we can help.