We all love Excel, and for most of us it's one of our go-to supply chain analytics tools. Many of us have used it to analyze our supply chains and to share insights and analytics with upper management. If your business currently uses Excel as one of its supply chain analytics tools and you’re running into a ceiling with what you can do – whether that means spending too much time maintaining your spreadsheets or your limited to the types of analysis that you can perform in a spreadsheet this article will show you how to break through that ceiling.
If you want to plan your next step in supply chain management, make data-driven strategic decisions, and gain confidence that your recommendations will make impactful improvements to your customers and the business this is the article for you.
I’ve been working in various supply chain roles for the last 17 years. Over that time I've used Excel to solve a myriad of problems like creating an MRP (Material Resource Planning) tool from scratch, optimizing to find the center of gravity for DC locations and break-even points in logistical service, performed transportation optimization for fulfillment, and built simulations. You can do a lot with Excel and anyone can easily collaborate with others because everyone has Excel and most have a good understanding on how to use it.
As great of a tool as Excel is it's not built for complex supply chains, so there are limitations. Those limitations translate to wasted time updating spreadsheets and making decisions based off models with questionable accuracy. Ultimately, the limitations in Excel translate to lost time and money. In this article, I will show how anyLogistix can help you push through these Excel Limitations. When you use anyLogistix in your supply chain, you'll have an agile, end-to-end supply chain analytics tool to tackle problems that go far beyond the limitations of Excel.
So people in most companies (big and small) will mention the above reasons on why they use excel and want to keep on using it. There is nothing wrong with that. But eventually companies run into limitations with excel because it’s not built for modeling real-world supply chains. How do you know if you’re hitting the limitations of excel?
If you need a way to answer questions like this without spending weeks in a spreadsheet, this blog will help you save time and money through optimization and simulation with anyLogistix.
The purpose of Excel is to manipulate, clean data and analyze. It’s not dynamic or holistic. It does not provide visibility into performance. Since you cannot capture the complexity of a supply chain in Excel, accuracy is questionable. Some optimization can be used with its solver, but you need to create new models every single time which takes time. Simulation in Excel is limited.
2. anyLogistix
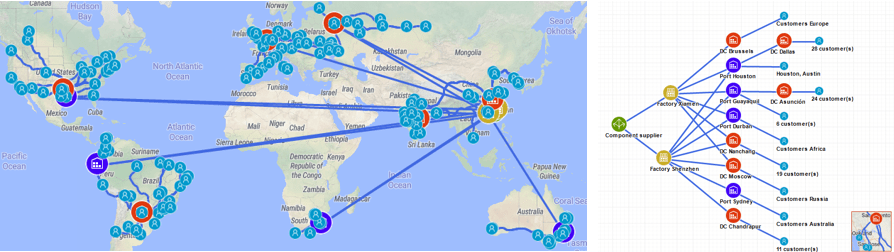
The purpose of anyLogistix is to capture the complexity of a supply chain in a model and help the user analyze the supply chain with different experiments. anyLogistix combines optimization and simulation. Optimization helps to find the best way to configure a network and simulation helps to determine how it will perform over time. anyLogistix is dynamic and agile because its simulation engine takes into account variability in the process, resources constraints (people, trucks, machines, etc, and risks over time. This helps to understand dependencies in the supply chain. Finally, anyLogistix animates the supply chain over a GIS map which helps with analysis and discussing options with other stakeholders.
Click here to learn how to compare supply chain scenarios with anyLogistix.
3. Excel vs anyLogistix for Supply Chain Analytics
Let me run through what typically happens in medium to large companies using a simple waterfall model methodology. Whether you implement a new idea or modify a current process/opportunity with a spreadsheet it will go through the following steps:
We use AnyLogistix for supply chain analytics because it improves this process. Here's the process in these projects.
In the first process using a spreadsheet, you need to prove the ROI just to move forward with analyzing one scenario because of the time investment to do the analysis. This becomes time consuming because every new what-if question means more time. It is inefficient. The process with anyLogistix is easier and faster. ALX captures the complexity of a supply chain and makes it easy to analyze multiple “what if” scenarios. It also makes your team more agile because every new what-if question and requirement can be done with a few clicks. ALX isn’t just more efficient, it is more effective because it includes animation, structure view, and a diagram of the process (See Images below) out of the box.
Gathering and cleaning the data is the biggest challenge, whether you’re using a spreadsheet or anyLogistix. In spreadsheets, there are minimal shortcuts but with anyLogistix you can reduce the time spent by automating data tables and simply importing a current snapshot of your supply chain when starting a new project. With this, you are on your way to creating a digital twin of your supply chain.
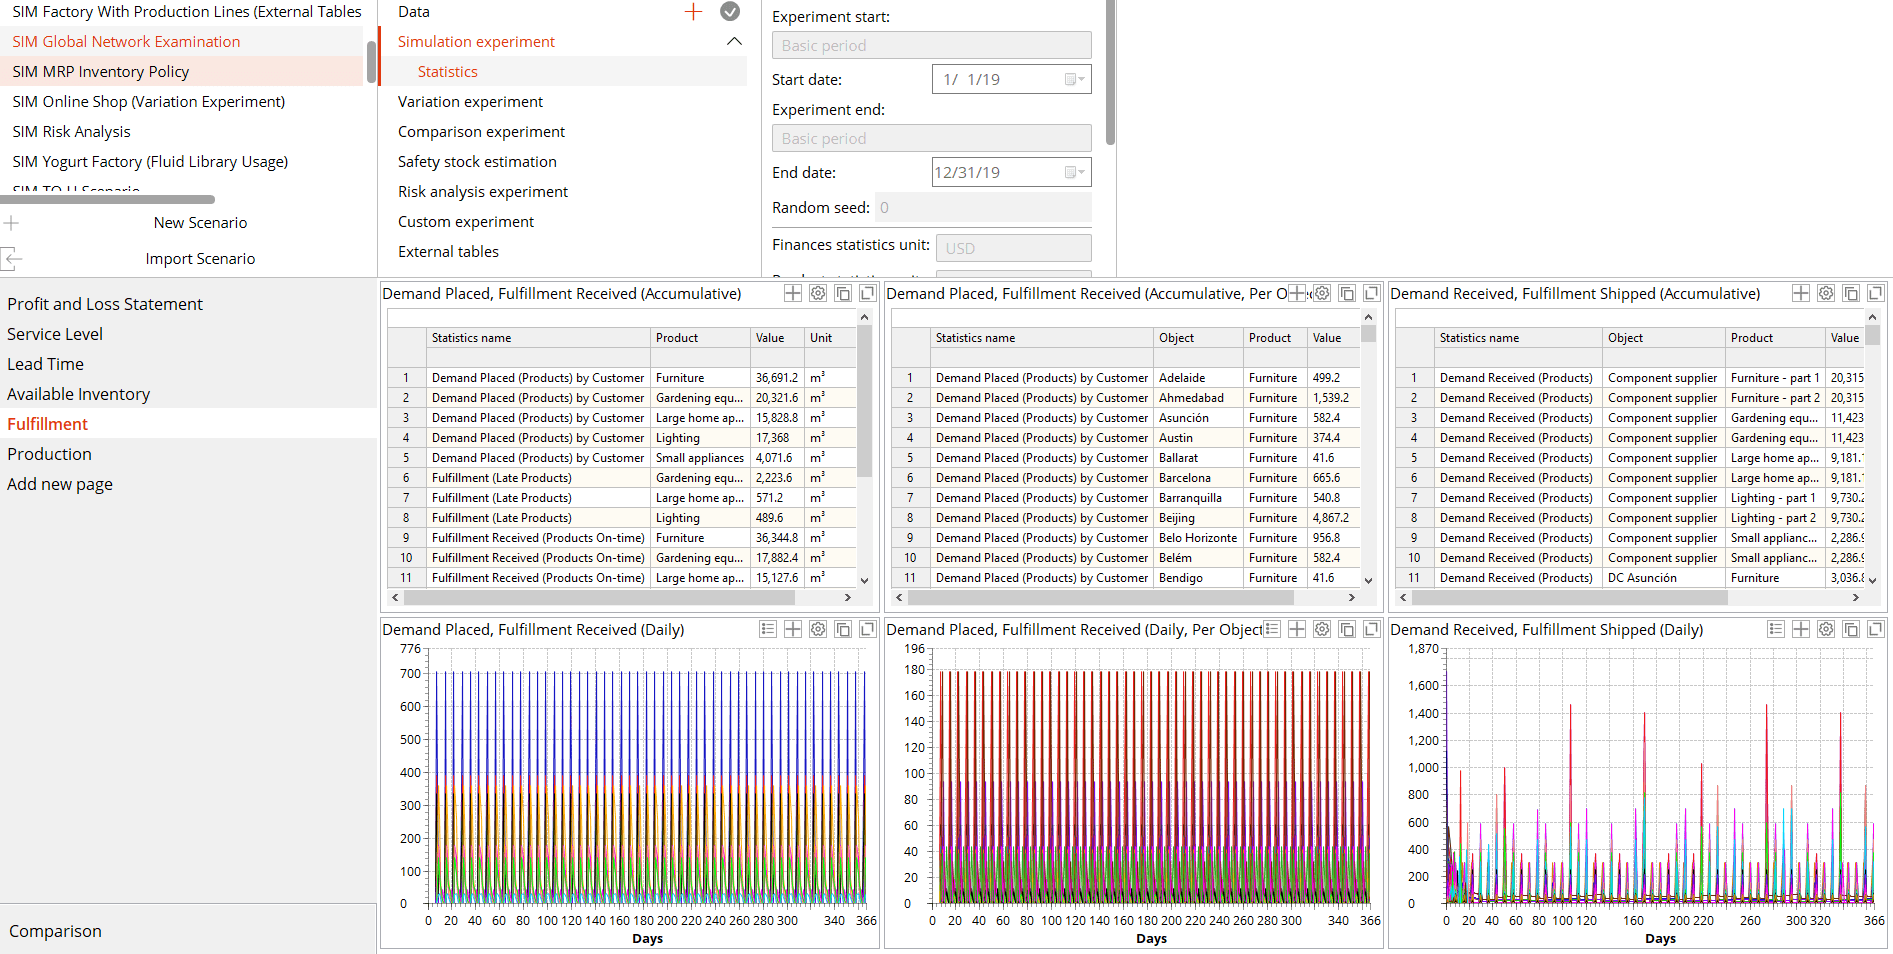
Dashboards in a spreadsheet are limited by what you can show and the type of analysis you are performing in Excel. Since you can’t capture the dynamic supply chain process with variability and resource constraints over time, you can’t show key metrics like service level, resource utilization, and an accurate Profit & Loss Statement. ALX has over 113 stats you can use in your dashboard from table, bar chart, line chart, histogram chart, and other types to compare analysis of complex scenarios captured when you build a model in anyLogistix.
Through my experience in modeling in supply chain analytics tools including Excel and AnyLogistix, I was able to identify the key benefits in using ALX (AnyLogistix) as:
AnyLogistix and excel are powerful supply chain analytics tools. Excel has facilitated the use of ALX as it allows organizations to gather, analyze, and format the data necessary for ALX to import and design accordingly. Due to this cooperation between tools it has allowed users to easily bridge from spreadsheets to simulation creating a stronger bond and success in future users to come.
SimWell is the distribution partner for AnyLogistix in North America and a leader in simulation and optimization solutions. If you're looking for supply chain analytics tools that help you make better decisions, faster we can help.
It starts with a conversation. Send us a live chat, or click Start the Conversation in the top right. We want to learn about your supply chain challenges and see how we can help.