Objectives
The main project objectives are:
- Model the conveyor network, and workstations as per layout
- Make the model layout configurable based on input parameters
- Number of stations as well as the number of conveyor loops are configurable
- Determine the time taken for each wave
- Determine the worker and station utilization
- Optimization of the model to:
- reduce the traffic on conveyor network
- reduce the travel distance on conveyor network
- reduce the lead time for processing orders
- increase throughput
- Develop a model animation and user configurable start up screen to test different scenarios.
Summary of the process
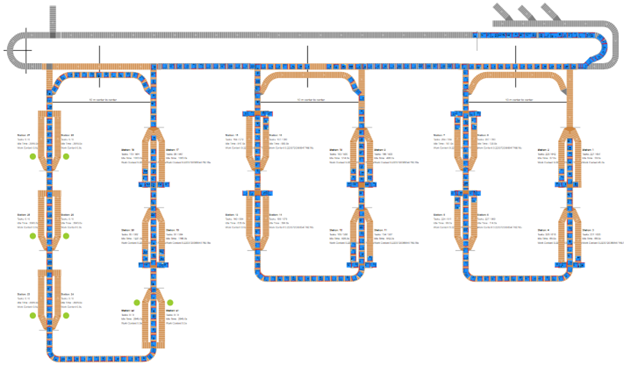
The SimWell team developed a Conveyor network as per the layout and it can be configured in case of further expansion of the facility by updating the number of loops and workstations in the model. All the workstations were connected in a series inside a loop and all loops were linked in a series between the feeding and exit conveyor. Loops were connected to each other by interconnecting conveyors. Conveyors move crates or cartons to the respective workstations.
The simulation was developed for two different process flow with two separate models as detailed below.
Delivery to the station
This is a process of order fulfillment for each workstation. Each workstation demands orders, and each order comprises of a variety of products with the required number of quantities. The demand for each station is fed inside the model through an input Excel sheet. Each crate will carry a single SKU (product) of varying quantities. Crates carrying SKU are sent inside the workstation to supply the required number of quantities demanded by each order. If the crates don’t carry sufficient quantities, those orders will be kept open until a similar crate satisfies their demand. Feeding of crates inside the conveyor network will be in sequential order data provided on the input sheet.
Crates are pushed to the conveyor network with the mentioned quantities of SKU in the Excel. Each crate will have a unique Id, SKU id, and quantity. The crate can either supply to single or multiple workstations depending on the demand. Once the crates were emptied at the station either, it can be picked out from the conveyor network at the station or empty crates can be allowed to exit the network at the exit conveyor. Process timing is involved on delivering each quantity of SKU.
Pickup from the station
This is an inverse of the delivery to station model. Each crate was considered as an order, and they are fed empty inside the conveyor network. The stations themselves have a stock of various SKUs. Crates will identify the list of workstations to be reached at the feeding entry. Logic was developed to send the limited number of crates inside each workstation. If the workstation was mapped with enough crates and if a new crate entering the network contains this workstation to be reached first, then this crate will not be sent to this filled workstation. Rather it can be moved to the next required workstation to ease the smooth movement, and reduce waiting, and lead time. Each crate can pick up multiple SKU and once all the necessary SKU are picked from respective stations, then crate will move towards the exit conveyor to exit the network.
Watch this video showing the model below:
How was the Simulation helpful?
- Simulation with animation of the process in 2D, helps to determine the optimal feeding sequence of crates into the conveyor system,
- to reduce queuing of crates in front each workstation
- in selecting the configuration that increases throughput of facility
- It helps to determine number of waves can be executed per day.
- Model can be used to monitor the utilization of workstations
Scenarios
User can be able to simulate my altering some controllable parameters provided on the model start up screen. User can modify the parameters listed below
- Conveyor type (Ranging from 3.5m to 5.5m of station length)
- Feed rate per minute
- Gaps between crates
- Size of the crates
- Conveyor speed
- Queue waiting time threshold
- Processing time
- Number of levels in loops
- Number of loops
- Crate feed sequence
- Station demands
The Results
Simulation model generates results and important KPI listed on the objective section based on different scenarios and helps to identify the optimal solution.