Objectives
The main project objectives were:
- Evaluate different drive-thru layouts and configurations such as full side-by-side lanes, single-lane, or side-by-side with merge into single-lane, the number of pull forward spots, etc.
- Estimate the total staff requirement given the order rate and channel mix, including the staff inside the kitchen and staff that will be taking and presenting orders.
- Estimate the number of equipment resources required
- Refine the staffing guide: roles and responsibilities for the staff where their duties and priorities vary depending on current restaurant needs.
- Refine the reorder point and order up levels for the food ingredients.
- Create a story-telling tool to allow stakeholders to witness what-if scenarios and see how solutions will work in the new restaurant.
AnyLogic software was selected as a simulation modeling tool, covering all client’s needs and objectives.
Simulation Model Summary
The new restaurant will be open all day, serving breakfast, lunch, and dinner, offering customers options to order using multiple channels: online order pick up with lockers, drive-thru, curbside pickup, carry-out orders for walk-ins, dine-in inside or outside of the restaurant. The customers (or cars if the channel is drive-thru) place the order and wait for the orders to be ready. The kitchen prepares all the order items for the order and hands the order over to the customer.
The discrete event simulation model, created by SimWell is completely data driven. The data includes:
- High level configuration such as start time and duration of model run, number of pull forward parking spots, the threshold for using pull forward, the number of staff at various work zones
- Order arrival rate and order channel mix
- Number of equipment resources and their type
- The staffing guide determining roles and priorities for staff inside and outside the kitchen
- All the menu items, along with their recipe or bill of materials
- The initial inventory of ingredient items, along with reorder points, and reorder batch size.
- The steps required to make each menu item in the kitchen, where these steps will take place, what equipment they will use, who can work on them and the processing times for both the staff and equipment for each step
- The order itself is sampled based on a defined product mix
Some of the main features in this model are:
- A fully functional drive-thru with cars moving, stopping to place orders, waiting at present zone to receive orders, moving to pull forward location if needed
- Roving order takers move to the cars in the order zone to take the order. Similarly, the order presenters move to the car to hand them the orders
- Ability to change staff schedule during the day
- Vary and sample orders based on a product mix and average number of items in an order
- Complete recipes of the menu items including ingredient consumption logic
- Data-driven ingredient stock-levels, when the item reaches a reorder level, automatic replenishment order is triggered and executed by kitchen staff
- The dine-in and online order pickup customers are modeled as pedestrians. Customer walks into the restaurant, places the order (an order taker comes to take the order), waits for the order to be ready, finishes eating in the dine in locations and leaves the restaurant. The complete customer flow for dine in and online order pickup is modeled
- The order arrival rate can be changed dynamically while the simulation is running based on the input data provided for order arrival times in the input file
- The staffing level can be changed during the model run
- The ingredients have a shelf-life, shelf-life times are tracked at batch level and once shelf-life time is reached for a batch, the remaining quantity is discarded.
- The ability for the user to configure an interval level at which KPI’s will be written to various reports.
How was the Simulation helpful?
The client plans to open a completely new restaurant and hence there is no historical data or performance benchmarks. The model helped in finalizing the drive-thru and kitchen layout.
In addition, the simulation model helped in determining the number of staff based on the expected order rate and meeting targeted experience time. Using the model, the client can find the ideal number of equipment resources required in the kitchen to meet demand and at the same time, maintain acceptable service times.
The model’s 2D and 3D animation helped visualize and tell a story of new restaurant operations such as: the flow of customers, staff movement, order backlog, car queue in the drive-thru, etc.
Scenarios
The model is data driven allowing for various scenarios to be easily run. It grants the ability to make quick changes without need to touch the model. These scenario and data changes could be done by the client. Here are the examples for the different scenarios that were tested:
- Change the order mix and see impact on service level metrics
- Change the staffing level in different staffing zones
- Change the staffing guide (priorities and responsibilities)
- Change the complexity of the orders (number of order lines)
- Run model with different order arrival rates based on hour of the day (high peak hours, weekends, holidays, regular off-peak times)
- Run side-by-side comparison of two scenarios to identify differences, gaps, bottlenecks, or improvements.
Animation
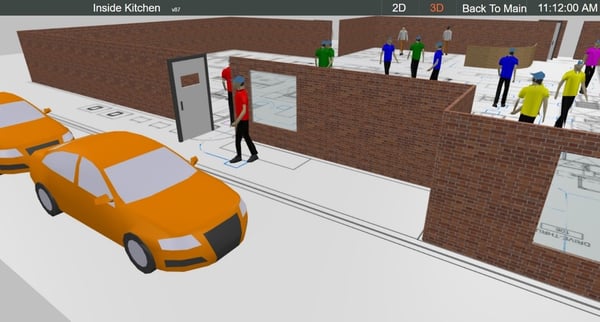
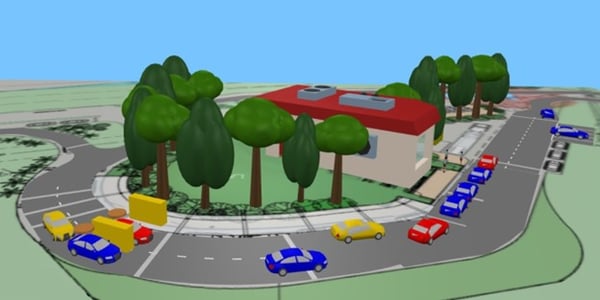
The model can be used for visualization, with the ability to execute the model at different speeds, allowing the user to navigate through the 3D representation as needed, exploring areas outside (drive-thru) and inside the restaurant (kitchen). The simulation model visualization contains animation elements like:
- Navigation panel to switch between screens
- 2D and 3D view of the drive-thru and kitchen. 3D animation includes roads and intersections outside the restaurant, using road traffic library to simulate traffic, restaurant building, staff taking and presenting orders. The 3D kitchen view has kitchen layout blueprint, walls, doors, and windows showing staff movement between kitchen work zones and customer process flow when picking up online orders and dining in.
- Dashboards window with drive-thru and kitchen KPIs.
The Results
Some of the main KPIs tracked in the model:
- The output channel mix and how it compares with the input
- The experience time by channel and how they compare against set targets
- The service time by channel and how they compare against the targets
- The drive through line length
- The input product mix as well as the sampled or output product mix
- The order complexity distribution
- The staff utilization and the time spent by them in different zones
- Staff time split by working, idle and moving time
- Equipment utilization
- Waste report for the ingredients
- Ingredient stock levels are tracked at a 5-minute interval
Most of the above KPIs are also tracked at an interval level. This interval itself is configurable from the input sheet. The results are captured at a detailed level. At the end of the model run these results get exported to an Excel file for deeper analysis. Using the model and configuring input data, the client and stakeholders can make important decisions regarding staffing levels for the new restaurant, define equipment capacity and quantity, explore order channels bottlenecks.
Tired of long waiting times and frustrating drive-thru congestion at your restaurant? Look no further – we've got the solution you've been searching for! At SimWell, we specialize in transforming quick serve restaurant operations to deliver seamless, efficient, and delightful customer experiences. Our team of experts understands the unique challenges you face, whether it's managing peak-hour rushes, streamlining drive-thru traffic or optimizing your work schedule.