Tableau is a top-of-the-line software for easily analyzing data. Sorting, filtering, statistics and, most importantly, visualizing data in all sorts of graphs and charts.
Spreadsheets just don’t cut it anymore
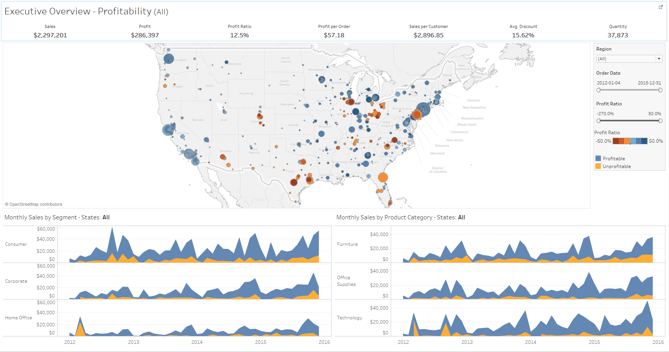
Tableau gives the ability to quickly create beautiful and easy to read dashboards combining, charts, maps, graphs and tables. The colors and formatting of the visualizations make them meaningful and effortless to explain.
Any data source can be used and the data can be updated in a flash. The size of the data sheets is virtually unlimited, as opposed to spreadsheet software like Excel. The user interface facilitates the process of filtering, sorting and calculating statistics for display.
Sharing the Business Intelligence Insight
Another great advantage of using Tableau to display data is that the dashboards are dynamic and allow filtering, sorting and highlighting on the go. Now, Tableau offers a secure and practical cloud version of the software to allow sharing the documents between users and organizations. A user can setup unique account for each customer or partner and share specific data sets and dashboards with them. The external user can use the online tool to view or modify the documents, depending on the specific permissions given to him. In addition to the web browser based application, Tableau provides great free mobile applications for iPhone/iPad/iOS and Android devices.
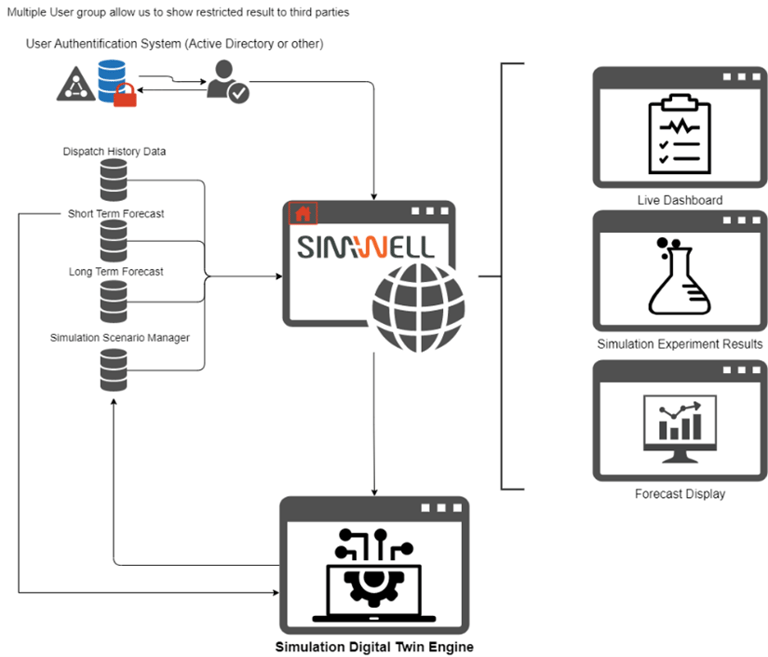
Combining Arena Simulation with Tableau
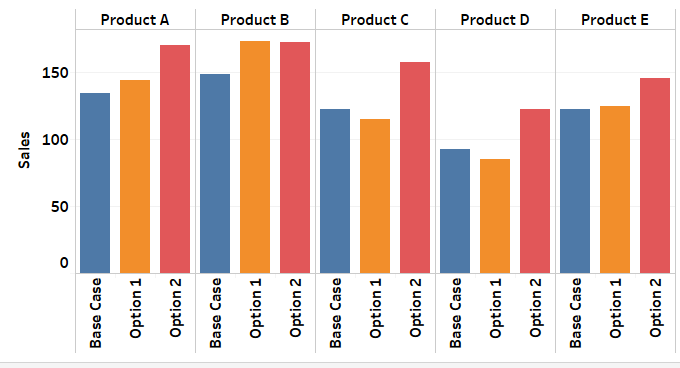
SimWell mostly uses Tableau to display and explain the results of the different scenarios executed with an Arena simulation model. Comparing historical data with detailed results also enables SimWell to quickly validate a simulation model’s behavior.
During a simulation project, SimWell will create a user account for the customer on SimWell’s Tableau Online site. They will post results and dashboards for their customer to view or edit, either from a browser or a mobile device. If SimWell’s customer prefers that the results of the simulation be kept off the cloud, then they may download and install a free “Reader” version of Tableau on their computer, to view the Tableau documents created by SimWell.