Case Study: Simulation Helps a Recreational Equipment Manufacturer Identify Bottlenecks and Increase Throughput by 40%
Overview
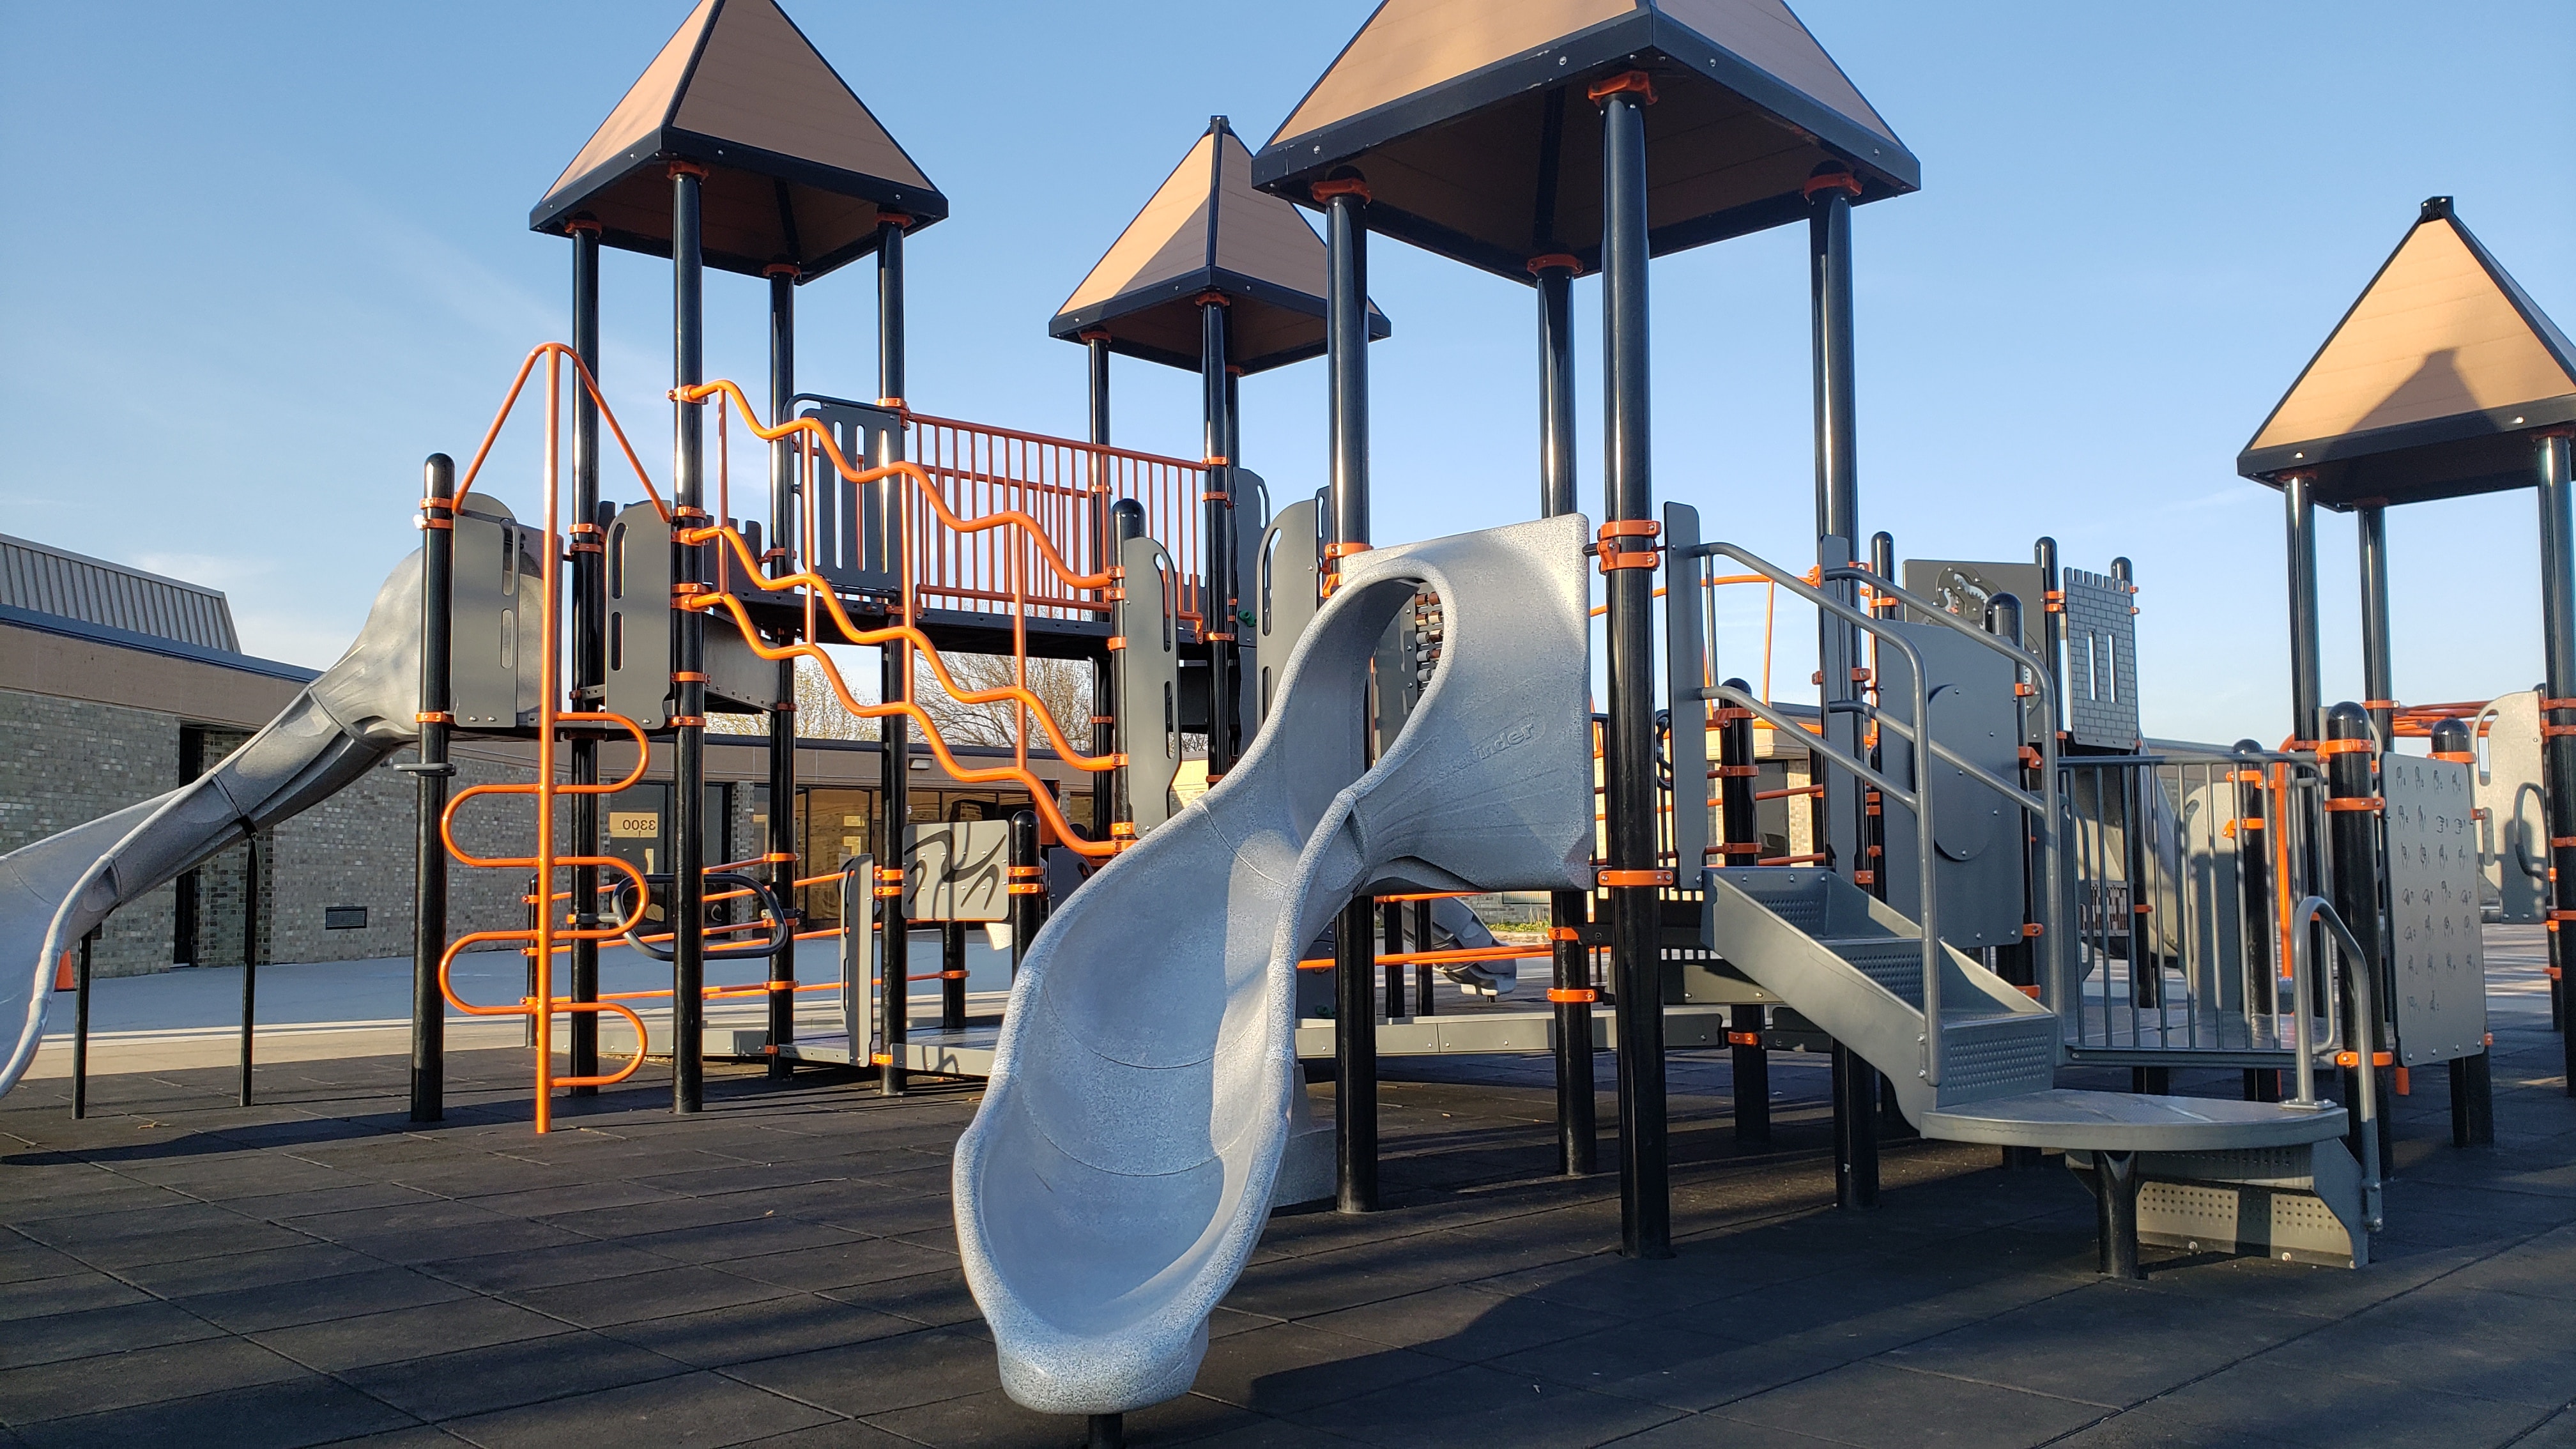
Our client manufactures outdoor recreational equipment, including playgrounds found at parks, schools, and backyards. Faced with growing demand driven by the pandemic, they partnered with logistics consultants and SimWell to build a simulation model to identify bottlenecks and evaluate trailer loading strategies for their shipping dock. From insight gained during a presentation of the simulation results, our client’s leadership quickly brainstormed a way to capture an identified 40% improvement in throughput.

Background
The shipping dock is in the plant that produces metal parts. Plastic parts are made at a plant nearby and brought over via trailer. Metal, plastic, and purchased parts are staged in the shipping area before being loaded onto the trailer. After departing the plant, trailers travel to customer sites (e.g., parks or schools) where the playgrounds are assembled. Since playgrounds for multiple customers are loaded in a trailer, the sequence of loading parts must be accounted for. The quantity of parts for a customer’s order varies by product line.
A crew works on a single trailer, staging and loading parts by hand or lift truck. The client wanted to know which resource was the bottleneck during this process.
Another question to be answered was how order sequence affects the number of trailers shipped in a day. For example, would it be a better loading strategy to alternate between loading trailers for the two product lines; load all of one, then the other; or some variation between the two extremes.
Solution
Enter SimWell, the simulation experts that guided them to solve their problem. SimWell developed a hybrid agent-based / discrete-event simulation in AnyLogic, modeling the future state of the shipping area. Given the time and event-based steps in loading a trailer, AnyLogic’s state charts were the best solution for modeling trailers and orders. This allowed for intuitive logical control of when an agent could enter or exit a state. For example, a trailer cannot move between states `Loading` and `Loaded` until all orders have been loaded, while an order cannot enter the `OrderLoaded` state until all parts have been loaded onto the trailer.
The simulation was delivered to our client as a standalone application that could run on their computers. The model was built in a parameterized way, meaning that business users without simulation or coding experience could change inputs to the model, run the simulation, and assess the impact of those changes.
These inputs included:
- The target number of trailers shipped in a day
- The quantity and size of parts by type for each product line
- Whether or not a part needs a lift truck to be moved
- Process times for:
- Painting metal parts
- Picking up giant corkscrew slides with a lift truck
- Finding the right location to place a part in a full trailer
- The number of crews on a shift
- The number of personnel and lift trucks in a crew
With a parameterized simulation model, domain experts can easily test what-if scenarios or update model parameters to reflect changes in the real-world system. This reduces the need for technical support after delivery.
The Outcome
SimWell used Monte Carlo simulation to test all possible order loading patterns to see if one sequence allowed for more trailers to be shipped per day. It was found that the order loading pattern had no effect on the number of trailers shipped per day. This insight allowed the manufacturer’s management to choose a load sequence based on other factors without having to worry about making a choice that negatively impacted throughput. Monte Carlo runs that only included one product line were also conducted. This showed that 40% more trailers could be shipped if all orders were of the product line that was faster to load into a trailer.
In the presentation of the simulation results to executives, they could see how stark the trailer load times difference was between the two product lines. The presentation was put on hold for 10 minutes as company leadership discussed the cause of the difference and what could be done about it. The product line with the faster load time has most of its parts shipped in a crate. This means the crate of parts is loaded directly into the trailer with a lift truck, while the slower product line requires each part to be hand-carried into the trailer.
Why can’t both product lines use crates for these parts? A phone call to a product representative revealed that the faster product line arranges for lift trucks to be at the customer park/school to unload the heavy crates of playground equipment from the trailer. The slower product line does not arrange for lift trucks to be at the customer site.
With a clearer view into their process provided by simulation, our client’s leadership was able to quickly devise a plan to increase their throughput by 40%: arrange for lift trucks to be at the client sites to unload the crates of playground equipment. This relatively simple change would allow for a more efficient loading process at the metal plant. The problem was complex yet viewed from a new perspective the solution became simple.
At SimWell, we model the complexity of your processes, allowing you to run experiments in a risk-free environment and see your business in a new light. From the insights gained, you will remove the hidden roadblocks and bring your business to its full potential.


