The Business Objective
The primary objective was to help franchise stakeholders answer critical questions about store operations like "What's the optimal way to set up the store?”, "What number of operators are required to maximize store efficiency?", “What circle of operations is more efficient?” This will help the organization to make better, data-driven decisions and move the business faster. In addition, it will help the corporate team communicate the need for change to franchisee owners. Ultimately, these improvements will increase efficiency, reduce labor requirements, and increase profit both at the store and for the corporation.
Solution
The trailblazer leaders of the restaurant chain turned to SimWell to help them develop a solution that will let them answer their critical business questions. SimWell determined that an agent-based simulation model was the best way to capture the restaurant's operations, re-create them, and give valuable insights.
The pizza restaurant chain wanted to focus primarily on deliveries and carry-out orders. The steps of product making could be split into several steps:
- Stretch dough
- Move to makeline to add toppings
- Bake in the oven
- Remove from oven, cut, and box
- Place on heat rack
- Assemble the remaining part of the order (drinks, salads, etc.)
- Take the assembled order for delivery (carry-out orders are presented at the front counter)
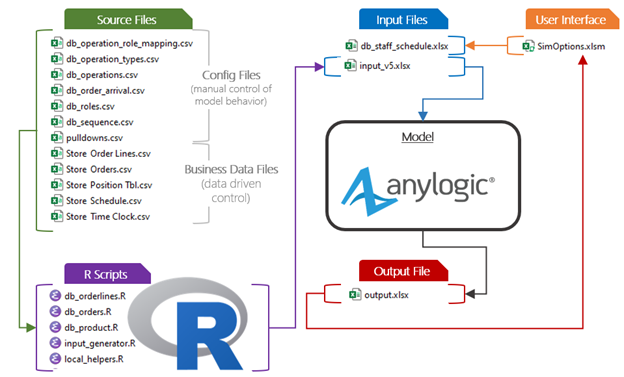
The simulation model, developed by SimWell includes all these steps to test the optimal number of workers for the store performing pizza-making duties, test the circle of operations required to maintain the store, and meet the targeted KPIs. The model is data-driven and allows the end user to test different scenarios and what-ifs situations. The input data for the model includes:
- A high-level configuration such as start time and duration of model run.
- Choose order source: either a hypothetical product mix sampling orders from menu items or real historic data from past orders.
- The staffing guide determines roles and priorities for staff inside the store.
- All the menu items with the ability to add new ones.
- The steps required to make each menu item with the ability to change processing times.
- Ability to change order arrival rate to run different scenarios for high peak flow, low peak, holidays, etc.
The main features of the pizza store model are:
- Ability to change staff schedule during the day.
- Choose different operation scenarios with adjustments (baseline, staff optimization, 3 scenarios for new circle of operations, varying staff duties, and workstation assignment).
- Change operation steps that the pizza worker needs to perform to prepare the menu item.
- Using the R scripts, generate input data for the model, based on system data provided by the client.
- As a result, compare model simulation outputs with historical data on a certain day.
How was the simulation helpful?
SimWell developed a simulation model of a pizza restaurant using AnyLogic simulation software. The model was delivered to the customer to use for further analysis. The client was impressed by the realism of the 3D animation and with the process’ accuracy. The new circle of operation that was created in the model served as a storytelling tool for the franchise and other stakeholders.
All user inputs in the model can be modified through a custom Excel-based interface, providing numerous possibilities for model analysis. On the output side, the model measures main KPIs such as time to load pizza into the oven, wait time, time to deliver pizza, kitchen staff utilization, and distance moved.
The simulation model served as a powerful tool for franchise stakeholders to visualize and analyze their typical store operations and make informed decisions.
Examples of scenarios to be tested
The model was designed to be data-driven, allowing for various scenarios to be easily run. Changing the inputs in the main UI makes quick changes without the need to modify the model itself. The scenarios and data changes could be done by the client’s model user. Here are the examples of the different scenarios that were tested:
- Optimization scenario – ideal number of operators during the store’s work hours
Using built-in optimization capability in AnyLogic, created an optimization experiment that minimizes the number of staff during the day using metrics such as minutes per order as a constraint. The optimization results are displayed as a Pareto Front dashboard in PowerBI.
- What is the impact of changing the circle of operations to a new setup (three sub-scenarios)?
A simulation model with the implementation of a new circle of operations allows the client to perform a deeper analysis of the benefits of the new approach. The analysis showed that improvement to wait time on average could exist when using the new circle of operations within the store.
- Impact of adding new equipment/resources.
The ability to test the impact of adding new equipment or resources is implemented in the model, allowing the client to perform analysis and help with decision-making when introducing new equipment to the stores.
- Congestion studies – reduce the number of steps that the worker needs to walk during the shift.
The initial analysis made showing a density map of the worker's movements between workstations and inside the store.
- The varying number of operators per workstation
Using an input staff schedule, the model allows assigning several workers per work zone, allowing the client to test different staffing scenarios and compare staff utilization and customer satisfaction metrics.
Animation to support communication
The model can be used for visualization by executing at different speeds, allowing the user to navigate through the 3D representation as needed, exploring areas inside the pizza restaurant. The simulation model visualization contains animation elements like:
- Navigation panel to switch between screens.
- 2D and 3D view of the whole pizza restaurant store. 3D animation includes walls, rooms, furniture, equipment, associates, customers, delivery drivers, the pizza-making process (pizza and non-pizza), associate movement between workstations, and order assembly.
- Dashboards window with KPIs.
- Orders window to showcase each order line item going between the workstations.
![]()
The Results
The model was tested on the historical order data from the client and proved to be valid and credible. The simulation model of the pizza store provided a way for decision-makers to gain insight into the system to help compare multiple circles of operation scenarios that are hypothetical and wouldn’t be possible to test without simulation.
Optimization capability from AnyLogic was included to test scheduling improvements and help subject matter experts to make better staffing decisions. Knowledge transfer sessions with client’s model users allowed them to continue exploring different what-if scenarios and perform deeper analysis.
Ask SimWell how we can help you with your restaurant operations
Get the best out of your restaurant operations by using the latest simulation and optimization technologies. Call us to discuss what challenges you need to tackle to survive or be the best in your restaurant industry.