The challenge: Keep buses evenly spaced
Any public transit agency knows the challenge of operating high-frequency bus routes, especially when it comes to minimizing bus bunching. Bus bunching happens because, if a bus gets delayed, then there will be more people waiting at the next stop than anticipated. The extra passengers' boarding time makes the bus even later, and so on in a vicious cycle. This results in clients’ waiting at a stop way longer than expected and then they see 2 buses bunched together arriving at the same time. This is frustrating and incomprehensible from a customer's perspective.
To mitigate this, some operators are using an operation mode method called headway management while others stick to the good old traditional timetables. While it’s impossible to operate a route with perfectly spaced buses and deliver a frequency that matches the plan, transit agencies have a lot of strategies to mitigate the variability of multiple factors that can break a perfect frequency: bus runtimes, drivers’ behaviors, ridership, boarding/alighting times, weather and road conditions, bus mechanical failure, etc. Any transit planner knows that adding layover time can’t be the solution; it will increase the clients’ travel time and generate huge costs that will lead to inevitable service reduction.
There are many solutions, know in advance which ones will work the best
Now, what a transit agency should or should not do to improve its high-frequency bus service? At SimWell, we do not know. But we can let you know by building you a tailor-fitted cutting-edge simulation model in which you can test your system with your own data and all the solutions you’ve dreamed of knowing in advance with outcomes. Know and prove what will happen, convince your stakeholders, and deploy with success.
Today most of the transit agencies are using static calculations to describe and diagnose what happened in the past. By using the AVL (Automatic Vehicle Locator) runtimes data they can build their schedules for the next booking or adjust the frequency based on the boarding data patterns they capture from their APC (Automatic Passenger Counters). But bus operations are complex because each route segment and each trip are linked to the other in a block which leads to a Cascade effect that your spreadsheet or your runtime software won’t be able to capture. So, as an example, it’s impossible to know in advance what would be the outcome of adding 1 minute of layover here and there or increasing the frequency from a 10-minute interval to an 8-minute interval. With so many strategies to choose from, there is absolutely no way of knowing the outcome of combined strategies. No way, really? That was before SimWell developed this solution.
The Solution
SimWell developed a simulation-based solution 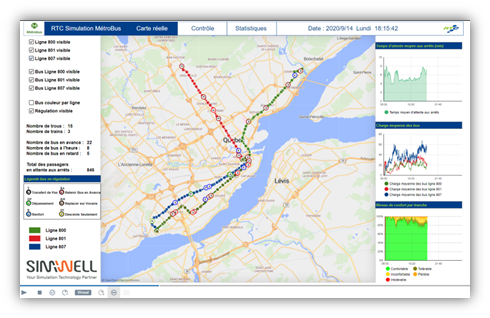 of the as-is system that allowed RTC (Réseau de Transport la Capitale) operating in Quebec city to understand, with confidence, the outcome of changing their schedules, implementing bus holding strategies, assessing the effectiveness of headway management, and all the other strategies they were thinking off. See the model in action here.
The simulation model has been built by analyzing each component that's part of service operation: run times, dwell times, ridership at each stop, passengers’ origin and destination, some of the drivers’ behaviors, etc. With rich data that comes from AVL, APC, and fare systems, all the resulting probabilistic distributions are programmed into the model and allow it to re-create reality. The model also easily runs any schedule from an excel file extracted from Giro’s Hastus scheduling software that RTC uses to build schedules. With over 30 strategies to test, with some having dozens of different parameters, it was undesirable to manually run hundreds Link to youtube video of scenarios, so an experiment plan was programmed to run all combinations of scenarios wanted and assess their performance with a main KPI (Customers’ Excess wait time). Scenarios can be run for specific days, months, bookings, or a whole year. This allows testing strategies throughout seasons and on a particular service day.
The outcomes
With their simulation model tailored-fitted to their environment, RTC can now test any strategies, convince all the stakeholders to implement them in a confident way, and transform them into optimal operating policies. They are now also considering using the model to test all-door boarding, stop spacing optimization, and daily schedule adjustments.
There are multiple ways to bring this solution to the next level: use it to train dispatchers in a serious gaming mode or integrate it as a digital twin that can prescribe actions to dispatchers or even automate decisions to leave dispatchers’ focus on tasks that are critical. The future is bright for RTC, know how yours can be by counting on simulation technologies to improve your operations.