INDUSTRIES

Oil and gas

Find out which upgrade actually clears the throughput before the capex committee votes. See what the chain does when two upsets land in the same week, a week before one does. Size the fleet to the service level you promised, ahead of the season that tests it. SimWell builds working models of how your operation behaves, so the hardest calls get made on evidence instead of conviction.

oil_gas_hero

The gap between the data and the decision

No one can make the call.

You have years of historian data. You have reliability records, availability by asset, rail cycle times, loading rates at the berth, and an engineering estimate for the upgrade that everyone has now read twice. Upstream production climbs on a schedule nobody is going to move, and the room is no closer to a decision than it was two quarters ago.

A hydrocarbon chain runs on clocks that never line up. The plant produces on its own rhythm, trains cycle on theirs, a ship arrives inside a window that moves with weather and berth availability, and stockpiles at separate sites rise and fall against each other. Storage fills while a vessel waits alongside. Cleanup after an upset eats availability that was already committed to the plan. A maintenance window taken in the wrong month costs far more than the maintenance. Push more volume through and none of it scales the way the design basis said it would, because the pieces were sized against each other rather than against a shared peak. The consequences of the hardest decisions stay invisible until after the commitment is made: the terminal contract is signed, the third train is deferred another cycle, the turnaround is scheduled into the same quarter as the production ramp.

Inside that reality, four patterns keep surfacing:

The operation

The room can't converge.

Storage fills and ships wait, so the terminal takes the blame, and the operating teams who watch it happen every week are not wrong about what they see. Reliability can produce a list of equipment that keeps taking availability out of the plan, and none of it sits at the terminal. Both readings hold up under questioning. Both come with real numbers behind them. The capital request goes back for another round of analysis, and the production increase stays exactly where it was on the schedule.

Nobody trusts the number.

The rated capacity of the upgrade comes from a vendor curve and a design basis that assumes equipment behaves and feed quality holds. Your operation has never run a year like that. Everyone in the room knows the number is optimistic and nobody can say by how much, which leaves an argument about a figure that cannot be tested and a decision that cannot be defended to the committee.

The tools show a snapshot.

The availability report from last month, the mass balance that ties out on the year, the throughput calculation someone rebuilt in Excel after the last incident. What the decision needs is the chain in motion: what happens to loaded tonnes when a train cycle stretches by six hours, how far a stockpile draws down before the next vessel arrives, how long the plant can keep producing once the sulfur stops moving. A spreadsheet holds one state of the system at a time, and the problem lives in the transitions.

The capability lives in one person.

One process engineer keeps the model everyone asks for, and each new scenario costs days of their time. Meanwhile the questions keep coming: every debottlenecking proposal, every turnaround sequence, every contract term that assumes a loading rate, every what-if the executive team raises after an outage. The queue at that desk grows faster than the desk clears it, and the engineer is one resignation away from taking the capability with them.

And it lands on you

The weight lands on one desk.

Someone signs the capex plan. Someone approves the turnaround window and the contingency stock behind it. The whole chain of interactions sits behind that name, priced in hundreds of millions of committed capital and in production that cannot be made up once it is lost. What none of the material in the room can show is where each option ends up, and the signature is due first.

The decisions oil and gas leaders own

Six decisions, and each one changes what the others can deliver, which is why they never settle one at a time.

None of these decisions arrives alone. Where the constraint actually sits decides whether the terminal upgrade is worth signing. What the upgrade clears decides how much contingency the operation has to carry. The contingency you carry decides what an unplanned outage costs you, and the outage profile decides how much of the turnaround plan survives contact with a bad quarter.

SimWell organizes its work around all six.

Capital & capacity

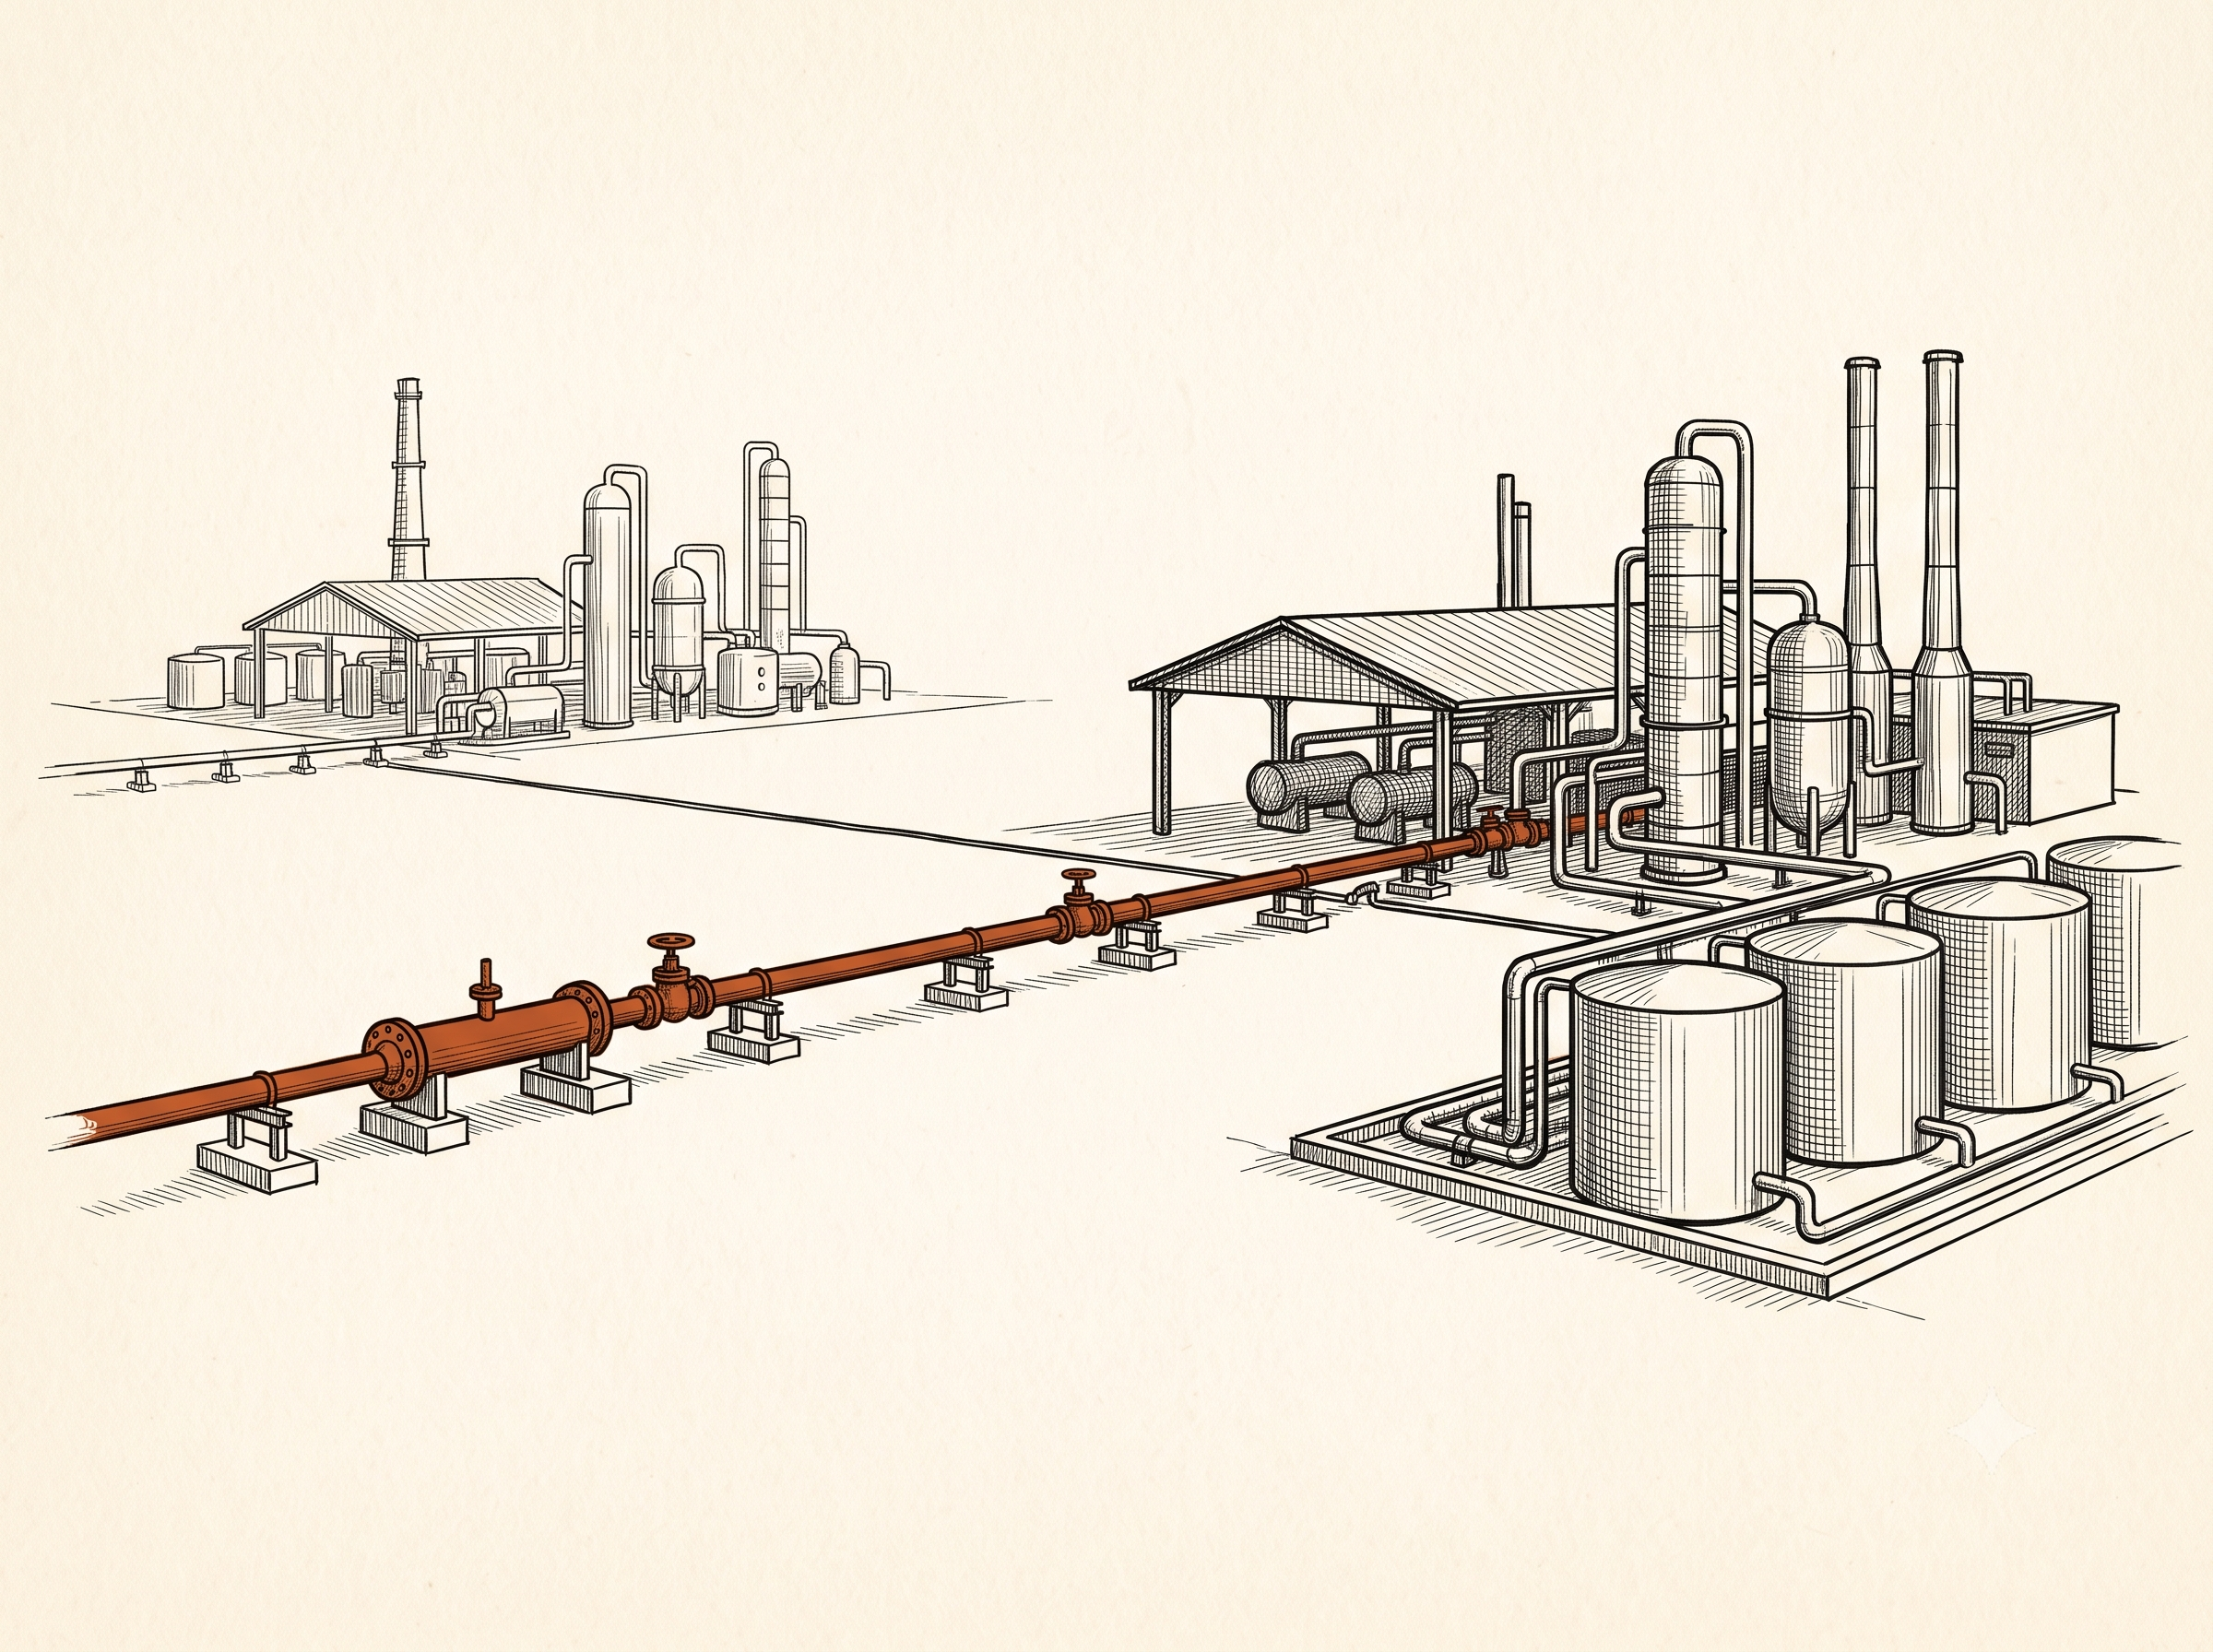
Whether to build, buy, or expand, and how much capacity to put in place for the years ahead. A third train, a terminal upgrade, a second berth, redundant equipment on a processing line, a pipeline that connects two sites currently running as separate operations. Commitments that run to hundreds of millions, that gate the production increase behind them, and that rarely come back cheaply once the order is placed.
Contingency & risk

What breaks when a compressor trips, a berth is lost to a collision, a maintenance window runs three days long, or two of those land inside the same week, and what the response should be before it happens at the plant gate. The upsets that matter are rarely the single events. They are the combinations that quietly walk the system toward a shutdown while every individual reading still looks survivable.

Throughput & bottlenecks

Where the constraint really sits between the plant and the ship, and what will move it, before spending to fix the wrong thing. The station that visibly backs up is usually reporting a problem set somewhere upstream, and the equipment everyone can watch fill up is the symptom the whole organization has learned to point at.

Routing & dispatch

How tractors, trailers, rail cars, and crews get assigned when the supply and demand points move with drilling activity, travel times change with the weather, and a road closure removes an option for two days. Dispatch rules that look like a detail on paper decide whether the fleet you own can hold the service level you sold.

Network & footprint

Where storage, processing, and loading capacity should sit across the chain, and how much stockpile each site carries against the others. Whether a new connection between two sites relieves the constraint or just moves it, which is rarely the answer the standalone business case assumed.

Staffing & scheduling

How many operators, maintenance crews, and loading personnel are needed, on which rotation, to hold rate through a turnaround and through the weeks either side of it, when contractor availability, shift coverage, and certification requirements all bind at once.

Why the current approach stalls out

Nothing in the chain runs on the annual average.

None of this is a criticism of how these operations are run. Historians, reliability data, mass balances, and planning models built and corrected over many years do exactly what they were built for, and the people who maintain them know their limits better than anyone. The decisions on this page ask a different question. They ask what the system will do once you change part of it, and answering that means carrying the timing, the queuing, and the way an outage in one place surfaces as lost production somewhere else three days later. No steady-state calculation was designed to carry that, and treating one as though it were is how a rated capacity becomes a commitment.

Average the year and you plan for a year the operation has never had. Equipment fails on its own schedule and not on the maintenance calendar. Weather moves travel times and berth windows together. Feed quality drifts, and a failure that reduces a machine's rate without stopping it produces a loss no availability figure records. Performance does not degrade smoothly while all of that stacks up. The chain absorbs it, absorbs it, and then a single additional upset takes the plant down.

WHAT SIMWELL BUILDS

We build decision systems.

The core of one is a working replica of your chain, validated against the operation itself and carrying the behavior a monthly report averages away: equipment that fails partially and keeps running at a reduced rate, train and vessel cycles as they land rather than as they were scheduled, weather acting on travel times, stockpiles drawing down against arrivals, the way an hour lost at one station shows up as a shutdown clock at another. Every option gets run through it, and the consequences surface while the capital is still uncommitted.

One model answers the question on the table. What makes the answer repeatable is the system built around it, ready when the question comes back: the next phase of the capex plan, the next turnaround sequence, the next production increase the market hands you. Your team runs it, reads the results, and makes the call. Nothing here replaces the platforms you already run, and the capability remains in the building once the engagement closes.

PROOF

Decisions made on evidence, not conviction.

oil_gas_hero

CASE STUDY

Everyone agreed on the upgrade. Was it the right one?

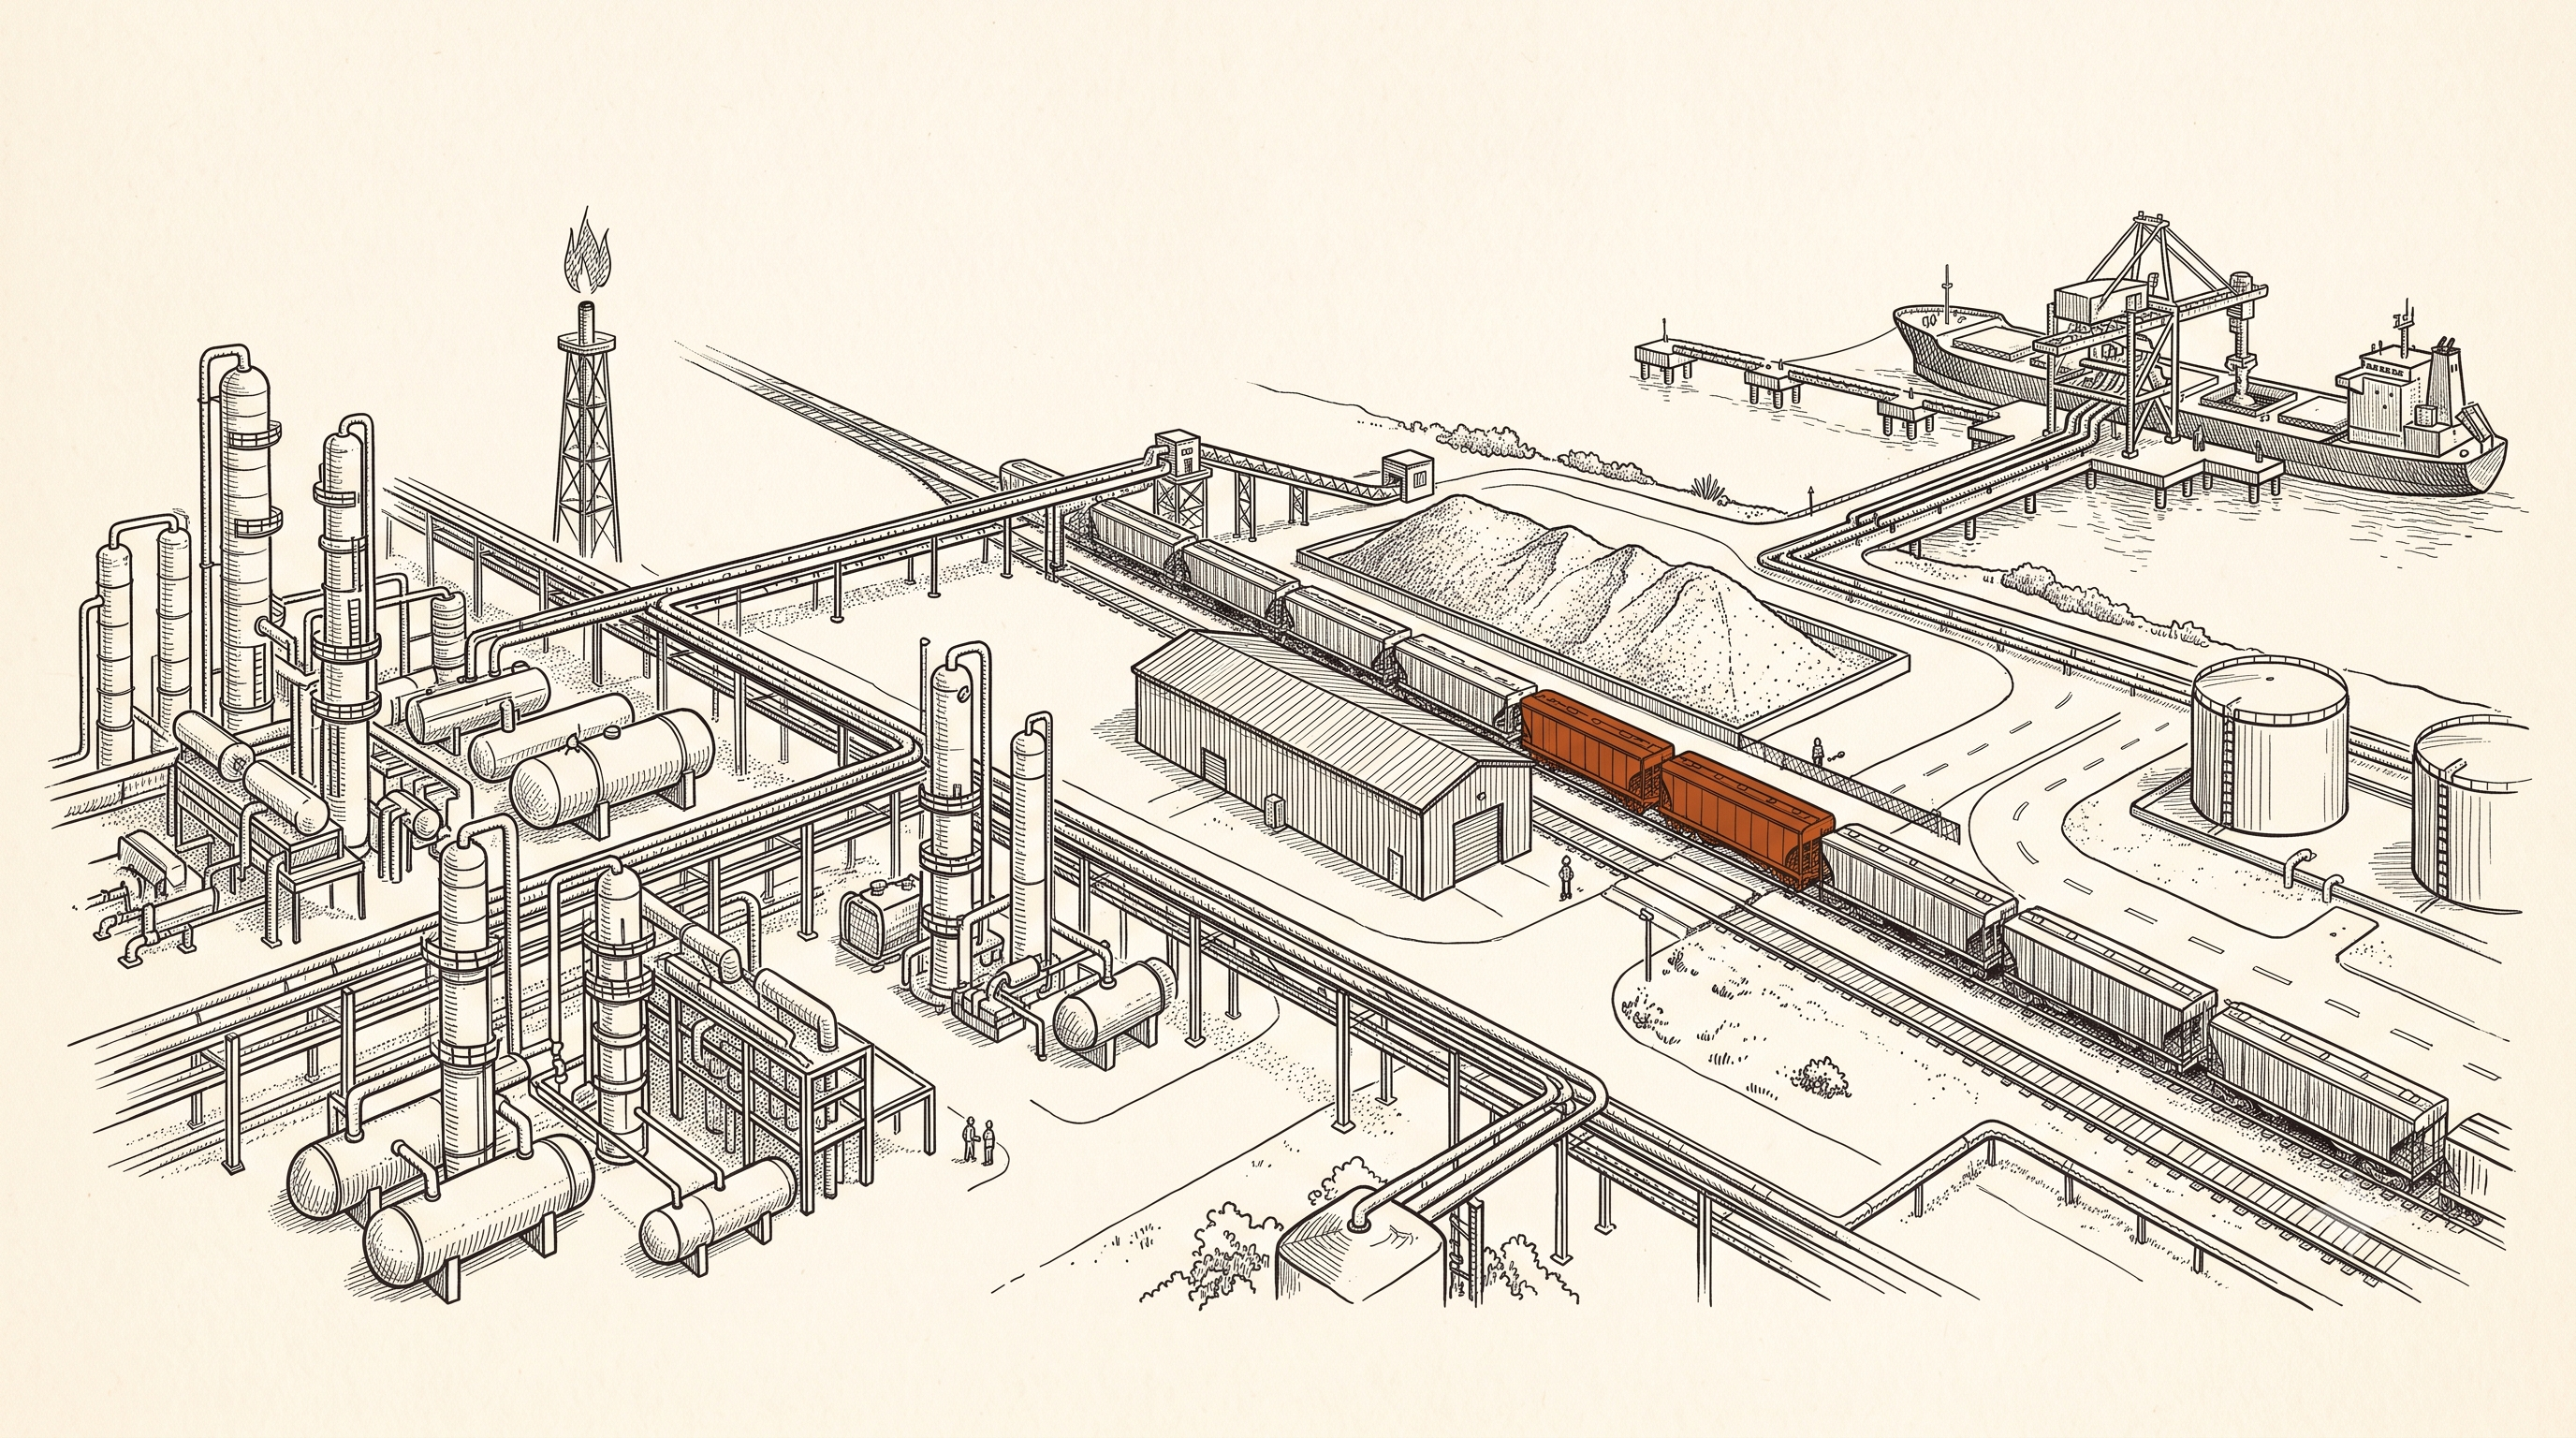
A sour gas operator was about to absorb a major rise in upstream production. More gas meant more sulfur every day through a chain already near capacity. Every operations team pointed at the terminal. SimWell modeled the chain and ran the operator's own fourteen upset scenarios against it. The bottleneck sat two stations upstream, and a terminal upgrade alone would not have reached the target. The committee got a sequenced capex plan it could approve item by item.

Read the case study
oil_gas_2

CASE STUDY

How big a fleet does a 100% service level actually take?

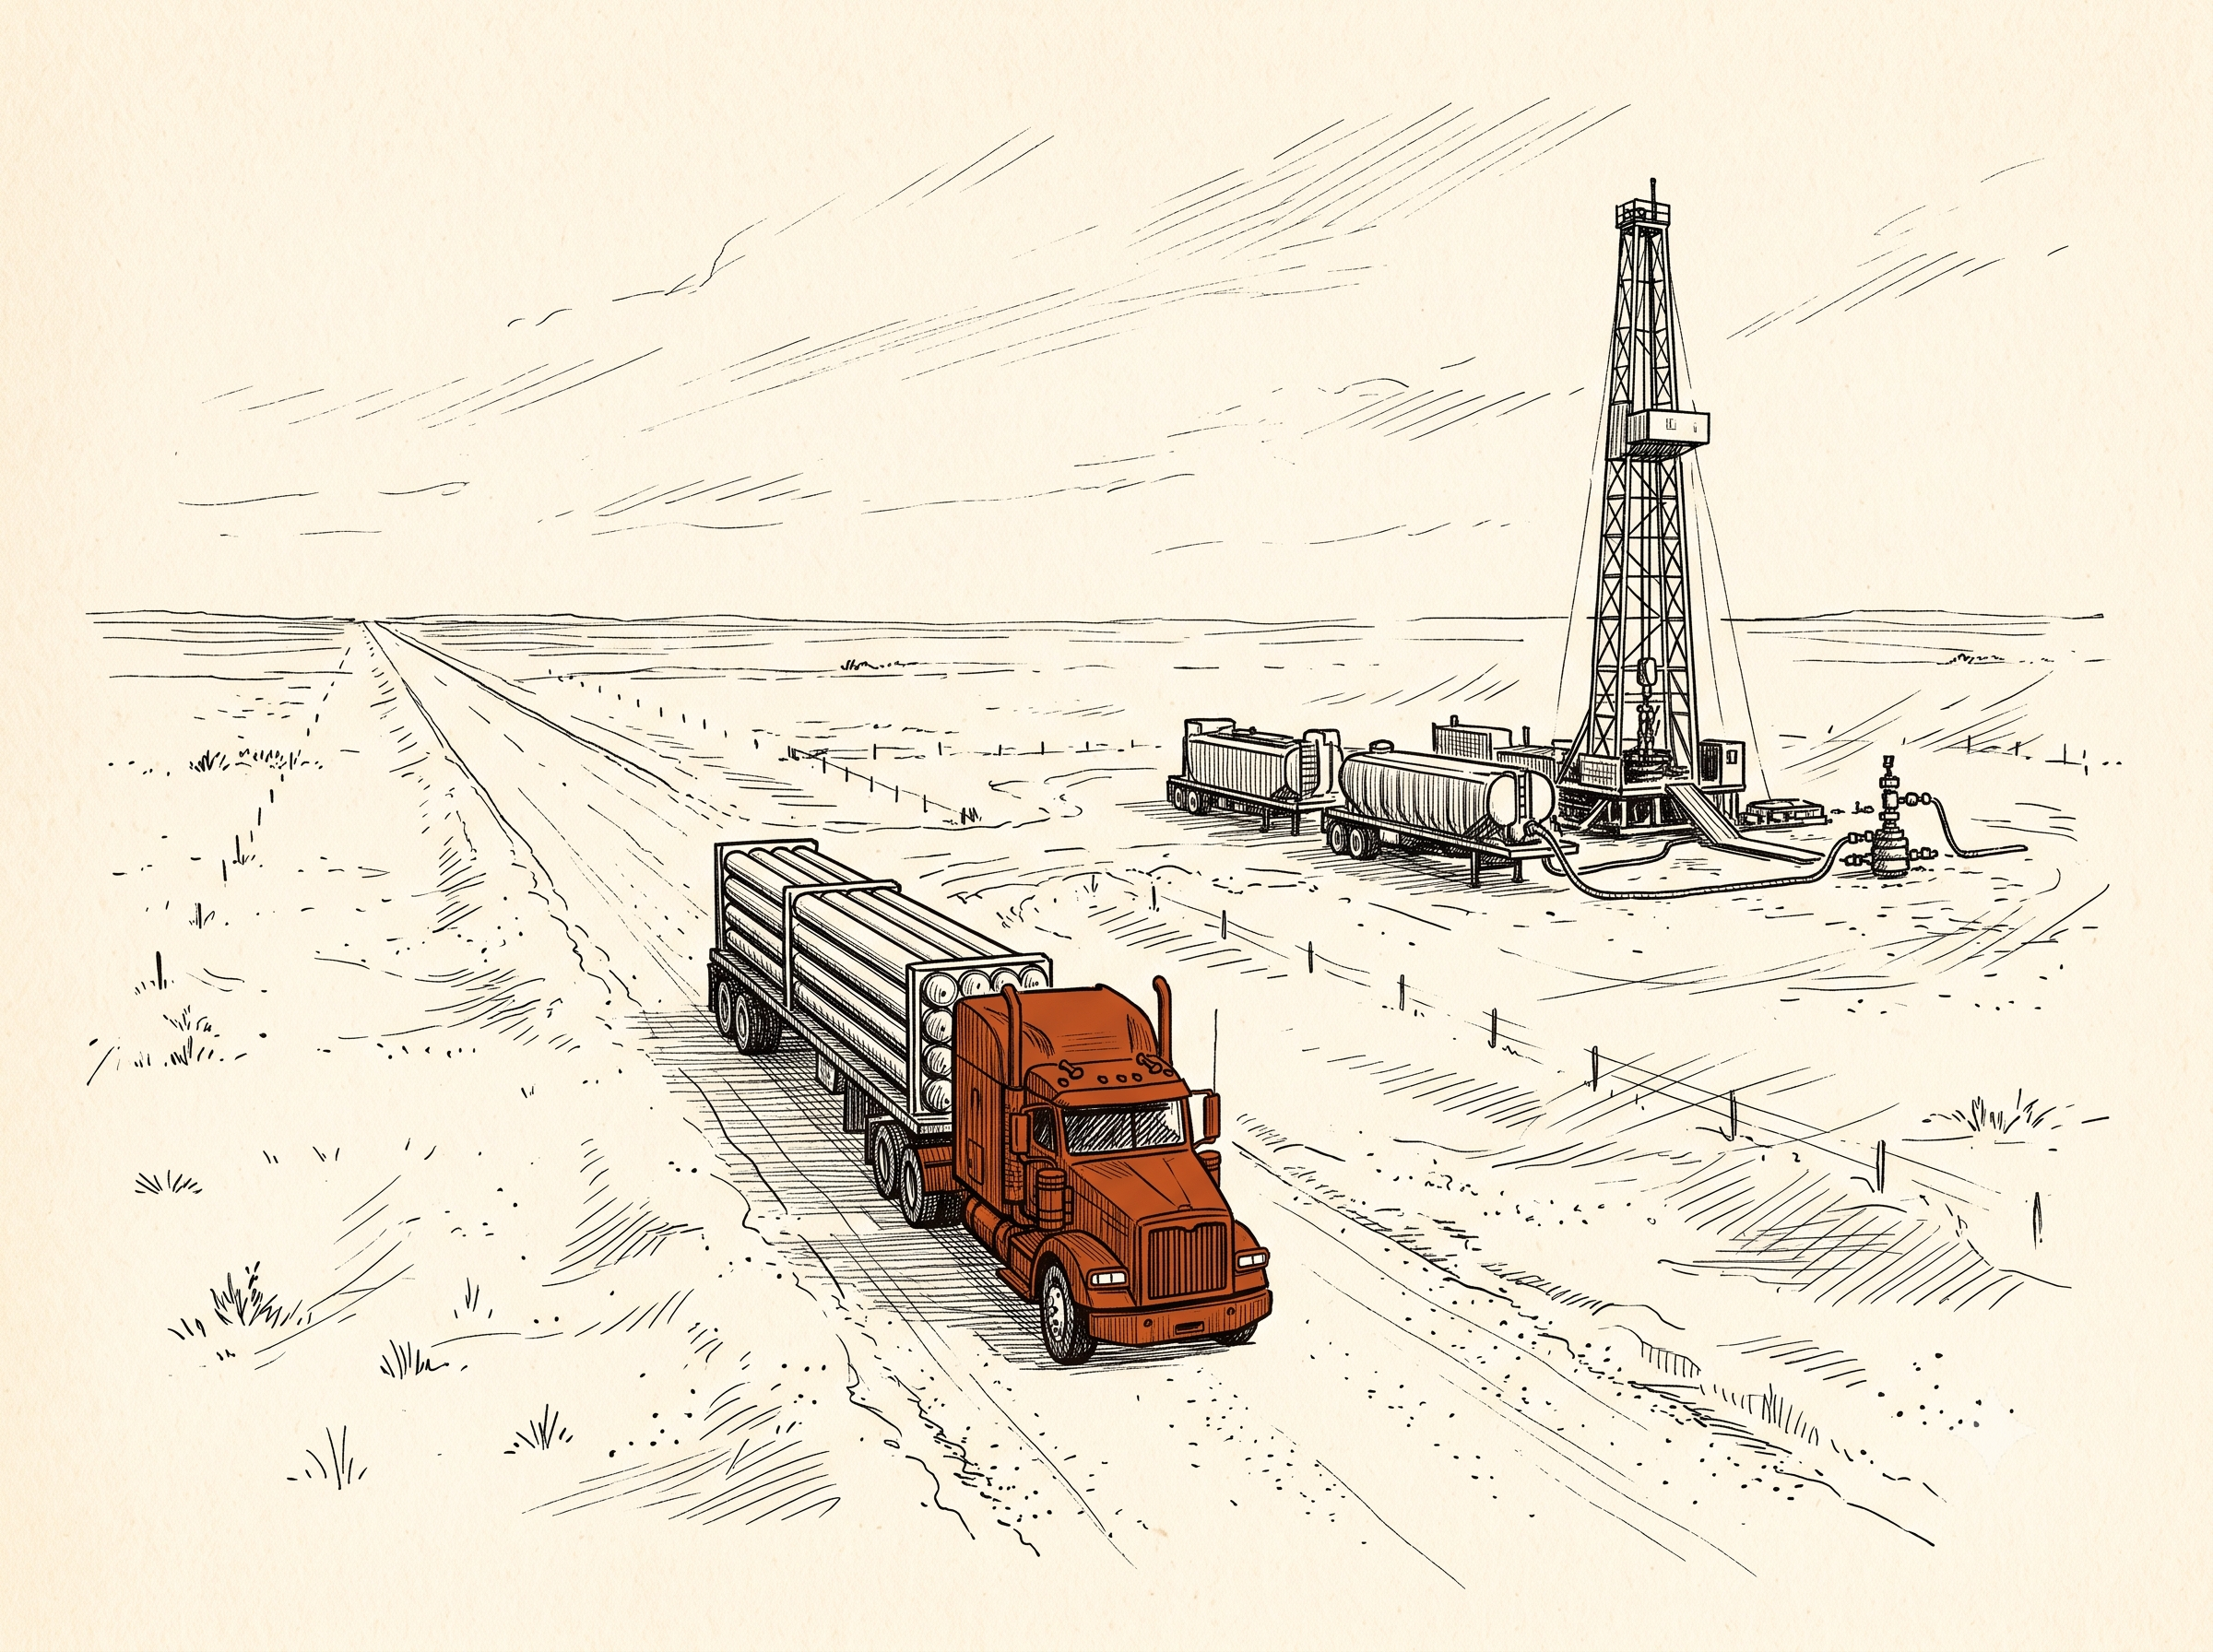
Ferus distributes compressed natural gas across North Dakota, where supply points and customers move with drilling activity and product sits in the distributor's trailers at customer sites. Weather, maintenance, and road constraints pull against the service level. SimWell built an Arena model on a coordinate grid of the road network, with weather carried by a Markov chain and a dispatching algorithm inside it. Ferus sized both fleets against a 100% service commitment, at the lowest cost that held it.

Read the case study
oil_gas_3

CASE STUDY

Which investment on the acquired site pays back first?

An oil sector operator acquired a competitor's processing operations and had to rank the investments: redundant machines, a pipeline between the two sites, or trading semi-finished product. Heuristics could not rank them; the options interact. Each machine carries up to eleven failure types, most of which cut the rate rather than stopping it, so the losses never show in an availability figure. A model of a full production year turned the decision into a multi-year plan instead of one approval.

Read the case study

HOW ENGAGEMENTS BEGIN

One decision, bounded scope, sized to the window the decision actually has.

  1. 01

    Frame the decision.

    The single call you have to make, the options genuinely on the table, the limits that actually bind, and the measures the room will judge against. If a model won't help, you hear that here, before anyone scopes anything.

  2. 02

    Build and validate the model.

    Scope follows the decision, and the build starts from what your operation already records. A complete data set is never the entry price. A first pass runs on historian exports, maintenance and failure history, cycle times, and the operating rules your superintendents can state from memory, and building it exposes which of the remaining data gaps are worth the effort to close. Your process and reliability engineers walk the logic as it comes together, until the model fails, recovers, and backs up the way the plant does.

  3. 03

    Deliver the decision package.

    Scenario results, the trade-offs written down, every assumption stated in the open, and a model your team keeps. You see the logic and the assumptions the whole way through, and we read the results with you instead of handing down a verdict, so what you carry into the capex committee survives questioning line by line.

WHY SIMWELL

Plenty of firms can build a model. Fewer can build one that holds up inside a real operation.

The modeling bench here is one of the deepest anywhere, and many of the consultants on it spent years inside processing plants, terminals, and field operations before they ever modeled one. They know why a design basis that clears every engineering review still misses its number in a year with two bad months, and they build for those months. Coverage runs from a single processing train up to a chain that moves product from the plant through rail and storage onto the vessel, which is why the model stays recognizable to the superintendent who has to live with the answer.

WHO THIS IS FOR

A decision this cycle where the downside is real.

A decision this cycle where the downside is real: a capex plan that gates a production increase, an upgrade sized against the wrong constraint, a service commitment written against a rate the chain has never sustained. If an engineering study or a spreadsheet already lost this argument once, start with that one.

Discuss the decision

Bring one question. If modeling can support a defensible commitment, we'll show you the smallest scope that gets you there. If a model won't help, you'll hear that in the first call.

Start a conversation

RESOURCES

More on the decisions oil and gas leaders own.

Case study

The Bottleneck That Wasn't

What a national operator found when it tested a terminal upgrade against fourteen upset scenarios before committing the capital.

Download the PDF
SimWell Decision Intelligence Capabilities eBook cover

eBook

SimWell Decision Intelligence Capabilities

The full picture of how SimWell turns operational questions into decision-ready answers.

Download the guide
Simulating the sulfur chain eBook cover

eBook

Simulating the sulfur chain: the questions to settle before a capex model starts

The questions to settle before a capex model starts, from scope boundaries between plant, rail, storage, and terminal through who owns the model after the committee votes.

Download the guide

eBook

Planning for upsets: how operators test contingency before the shutdown clock starts

How single failures combine into the events that take a plant down, how to build an upset list operators recognize, severity banding, and which mitigations have to be pre-positioned rather than decided in the moment.

Download the guide