Technology Overview
 Digital Twin
 Route Optimizer Tool
 Software Overview
 How it Works

What ICP refused to buy
ICP had been pitched before, and the leadership knew the two outcomes they wanted to avoid. The first was the consulting deliverable that arrives as a slide deck and is out of date the day it lands, a snapshot of a network that has already moved. The second was the black box: a model so opaque that the team who paid for it cannot open it, question it, or maintain it without calling someone back. Both leave the organization exactly where it started, dependent on an outside party to answer the same question the next time it comes up.
What ICP wanted was the opposite. They wanted to own the capability. A model their own planners could run, interrogate, and trust, built on a process they understood, so that network design became something the company did on a cadence rather than something it commissioned. That goal set the bar for who could help build it.
ICP chose SimWell to do the work with them, not for them. The engagement was structured around three design problems the network had accumulated:
- Footprint: how many distribution centers, and where, to serve North American demand
- Asset use: how to realign plants and DCs to strip out the redundancies acquisition had layered in
- Transportation and distribution: how product should move, and at what cost to serve
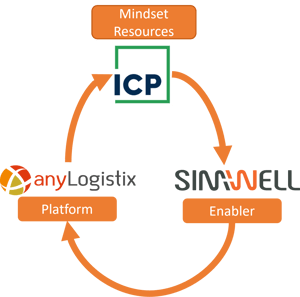
SimWell paired its consultants with ICP's team and built the model in anyLogistix, the simulation and optimization platform underneath the work. The platform let the team consolidate and standardize data from across the acquired operations, move directly from greenfield analysis to network optimization, and add facilities or change assumptions as the design questions evolved. Every step was built to be handed over, because the point was never a single answer. The point was a capability ICP would keep.
Building a model ICP could keep running
A model is only a capability if the people who own it can feed it, trust it, and run it again. SimWell built ICP's around that requirement from the start, which shaped both how the work was run and how the system was put together.
The work ran in short, iterative cycles. SimWell built, validated, and tested against real ICP data, brought results back to ICP's team for feedback, and adjusted. That agile rhythm kept the model anchored to the decisions ICP cared about most at each stage, and it meant ICP's planners learned the system as it took shape rather than receiving it finished and opaque at the end.
The architecture was built for the same reason: not to produce one analysis, but to keep producing them as ICP's network changed. Three components carried the load.
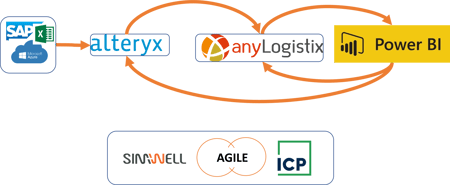
- Alteryx pulled data out of ICP's source systems, then cleaned and consolidated it on a repeatable schedule, so refreshing the model never meant rebuilding it by hand.
- anyLogistix ran the simulation and optimization, the engine where greenfield analysis and network optimization actually happened.
- Power BI surfaced results in dashboards ICP's team could read directly, validating each iteration and feeding the next round of decisions.
Together these turned a one-time study into a living model of ICP's network. Data flowed in from ICP's own systems on a cadence, the optimization ran against current operations, and the results came back in a form planners could act on. That standing loop, connected to ICP's production data rather than frozen at a single moment, is what made this a supply chain digital twin and not a slide deck with a shelf life.
Results
SimWell and ICP built the baseline first: a model of ICP's network as it actually ran, accurate enough that ICP's team trusted what it said. From there, the SimWell team ran the two analyses ICP's questions called for.
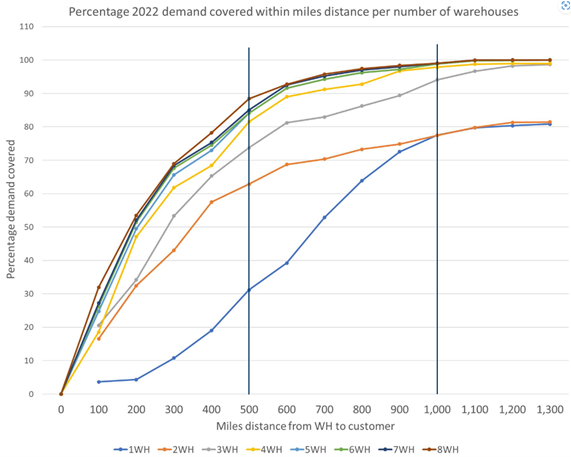
Greenfield analysis answered the siting question. SimWell modeled how many distribution centers ICP would need, and where, to cover North American demand within target delivery distances. The model showed how coverage changed as centers were added, quantifying what each additional location bought in reduced average miles to the customer, and gave ICP's leadership a clear, visual basis for deciding how many warehouses the network should carry.
Network optimization answered the cost question. SimWell's team compared network configurations against each other on financial and operational terms, so ICP could see which design served demand at the lowest total cost rather than guessing from proximity alone.
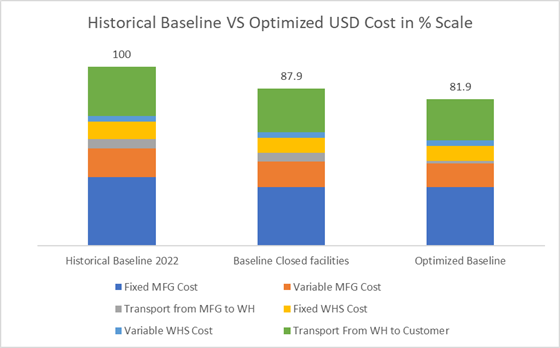
The numbers came in two stages, and the order matters. Against ICP's 2022 historical baseline, SimWell's models identified an 18% supply chain cost-saving opportunity. SimWell then built an adjusted baseline that accounted for facilities ICP had recently discontinued, stripping out savings the company would capture anyway, and compared the optimized proposal against that tougher, current-state benchmark. The validated, attributable saving against that adjusted baseline was 7%. The first number is the size of the prize the analysis surfaced. The second is what SimWell stands behind after holding the model to current operations.
That progression is the point. ICP did not get a single headline figure to take on faith. They got a model that showed its work, separated gross opportunity from validated saving, and gave the planning team a defensible number they could act on and reproduce the next time the network changed.