

Decision Workshop
Know which problem to solve first.
Two weeks, two days on your site, and you walk out with a ranked map of what is costing you and what to do about each item. Some you fix yourself next month. Some are worth a model. The map is yours either way.
Sound familiar?
›The number has been sliding for quarters, and every meeting produces a new cause
›We fixed the bottleneck everyone pointed at, and output did not change
›We have tried to solve this before, and the project stalled before it got going
›We are not ready to commit to a build, and we still need a plan we can defend
›Someone has to bring a number to finance, and nothing behind it holds up
- The number has been sliding for quarters, and every meeting produces a new cause
- We fixed the bottleneck everyone pointed at, and output did not change
- We have tried to solve this before, and the project stalled before it got going
- We are not ready to commit to a build, and we still need a plan we can defend
- Someone has to bring a number to finance, and nothing behind it holds up
Why the last fix stalled
Everyone has a theory. No one has the list.
On-time delivery slid after the system cutover and never came back. Throughput is stuck below the number the plan assumed. The planning team already knows something is wrong and assembles its own picture by hand each week. What no one has is a shared list of the problems, ranked, with an estimate of what each one costs.
So the fixes start with whoever argues best. A dashboard gets built on the measures someone happened to have. A capital request goes in for the machine everyone points at. Months later the metric has not moved, and the next attempt starts from the same blank page.
How it runs
Two weeks. Two days of it with your people, on the floor.
Set the table
We confirm the stakeholders, agree the boundaries of the process we will follow, and take a first extract of your data so the site days start productive.
Walk it, map it, break it
We walk the path an order, a patient, or a railcar actually takes, map the steps with the people who run them, define what has to go right at each one, then flip each of those into what goes wrong.
Put a number on it
We build the process map and data assessment, put a cost on each problem with your team, rank the list together, and present the plan in a readout to the people who sign off on the next step.
We leave the site only with an agreed map and a complete list. If that is done early, the visit ends early.
The days on site, up close
Four moves, in order
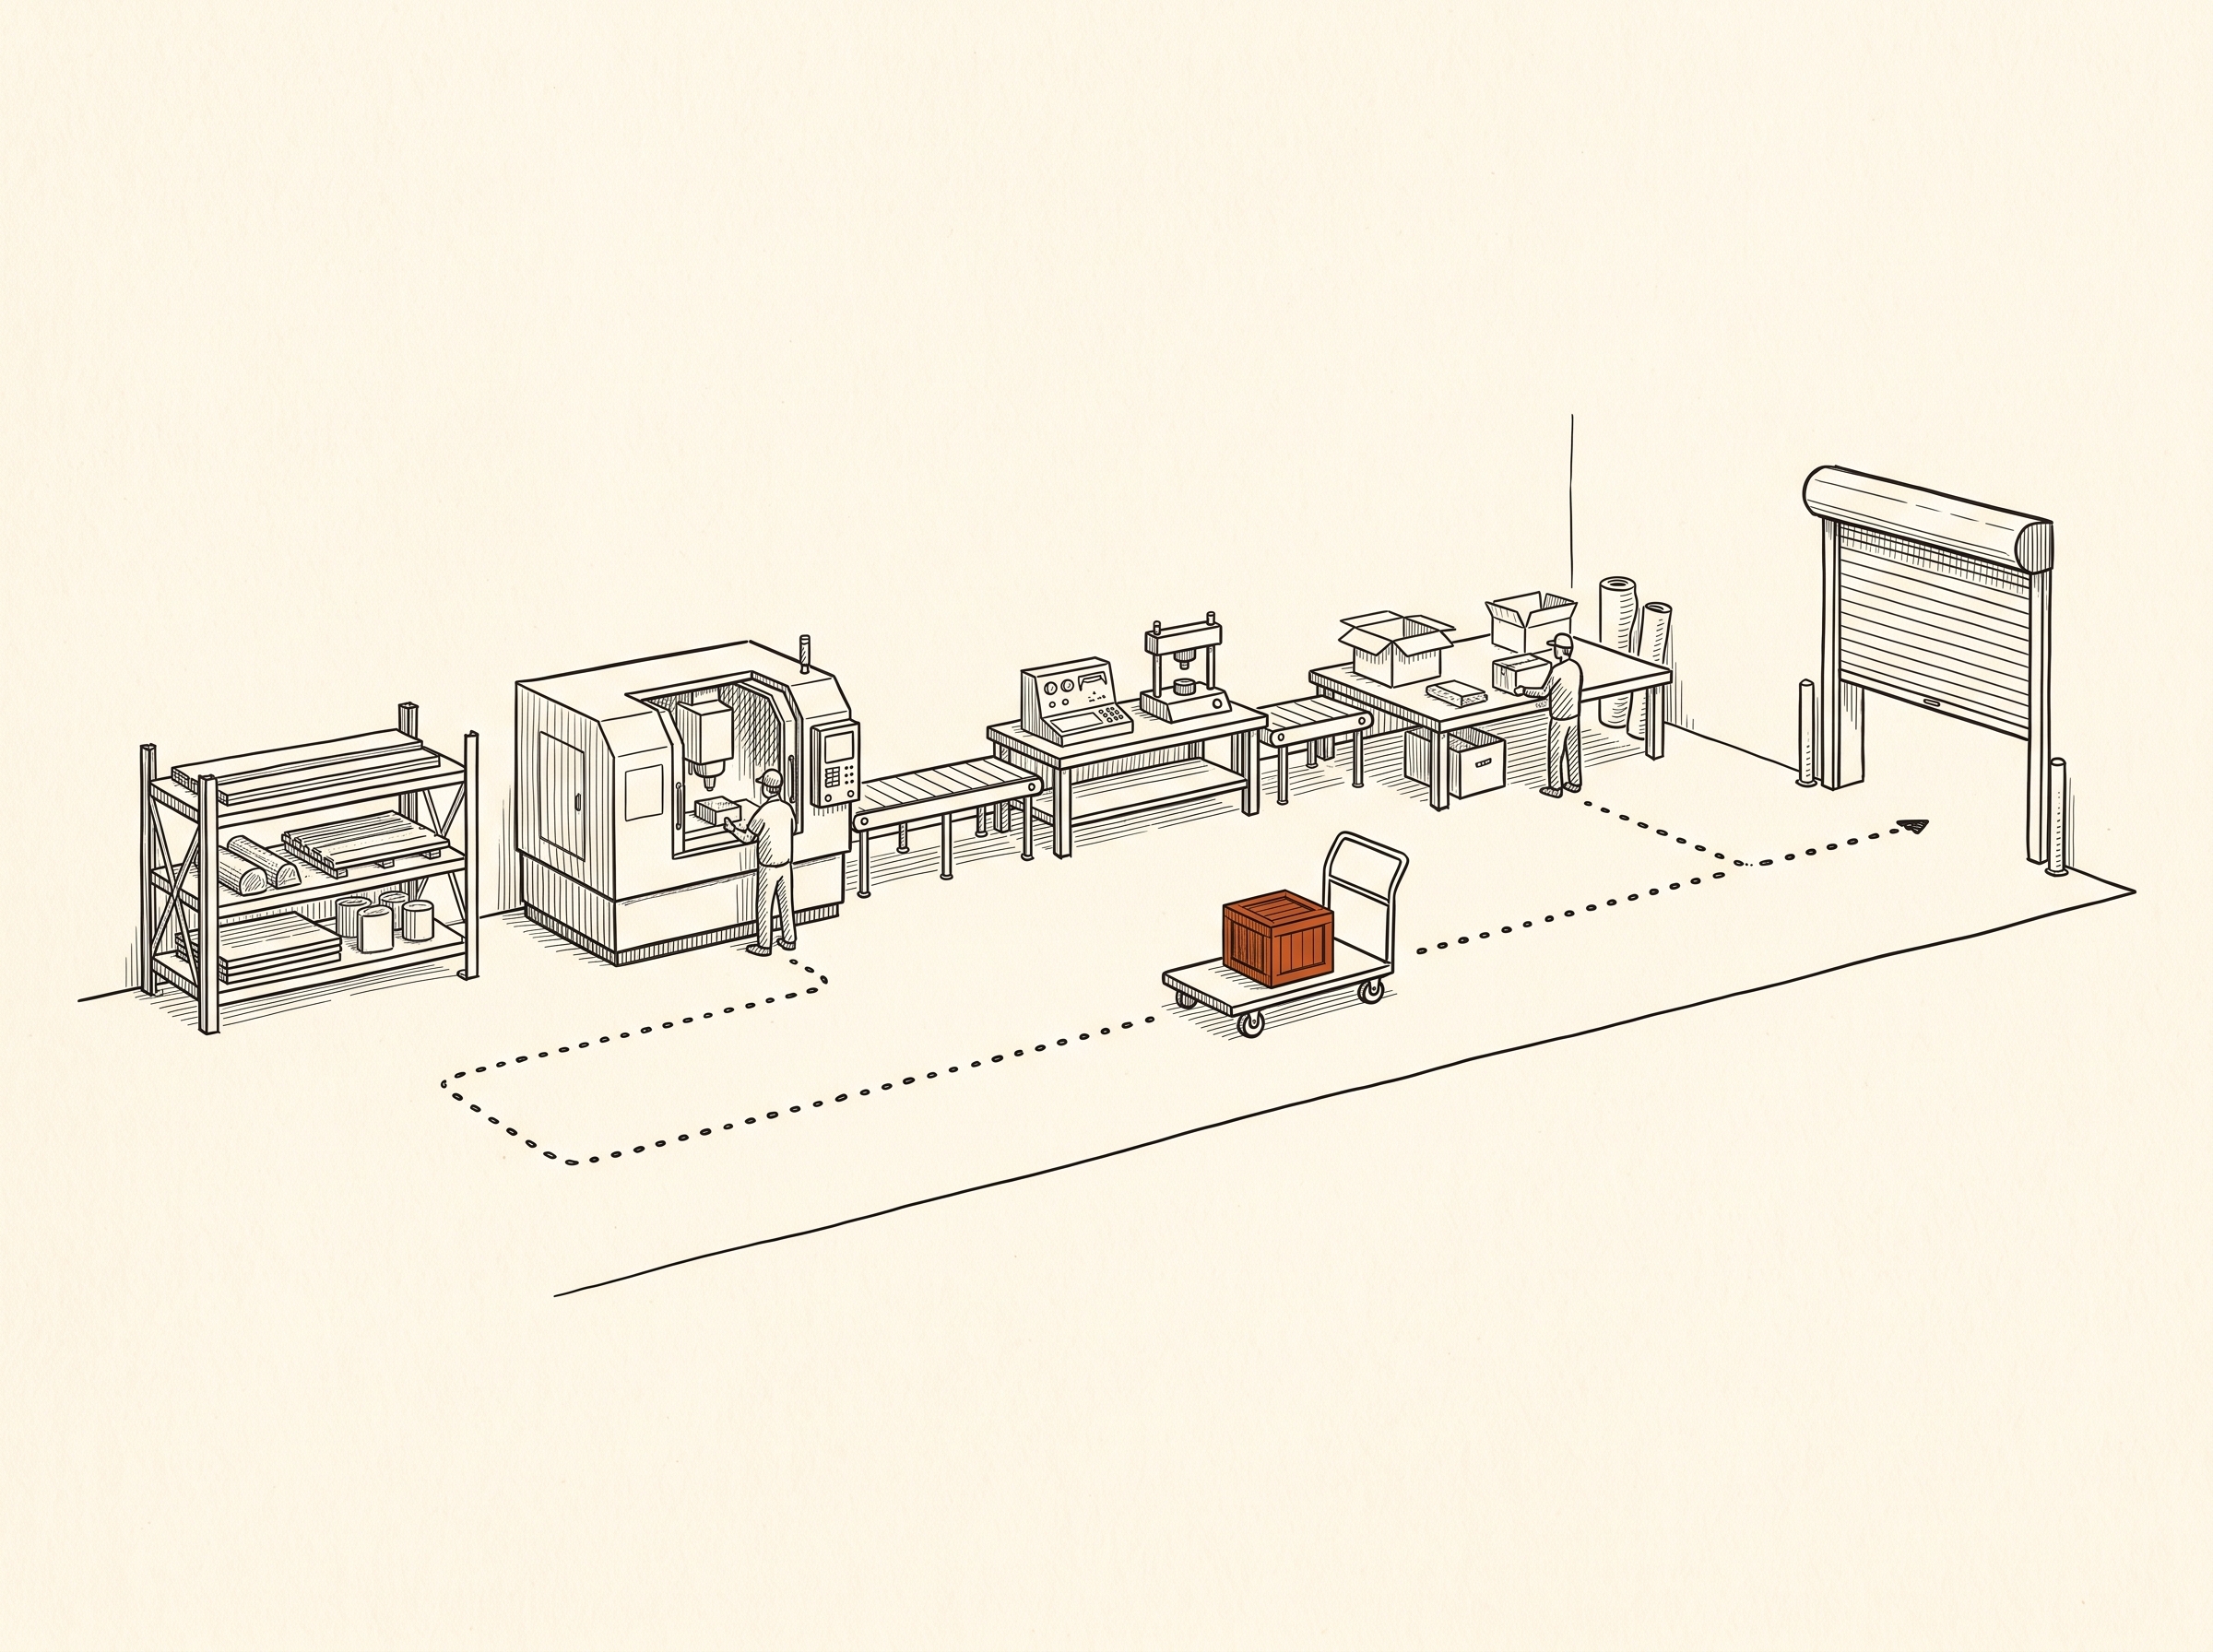
Walk the path
We follow one unit of work from release to done: material, fabrication, test, ship, or whatever your version is. The floor shows what the process document leaves out: the queue nobody owns, the step that runs on one person's memory, the handoff that happens by text message.
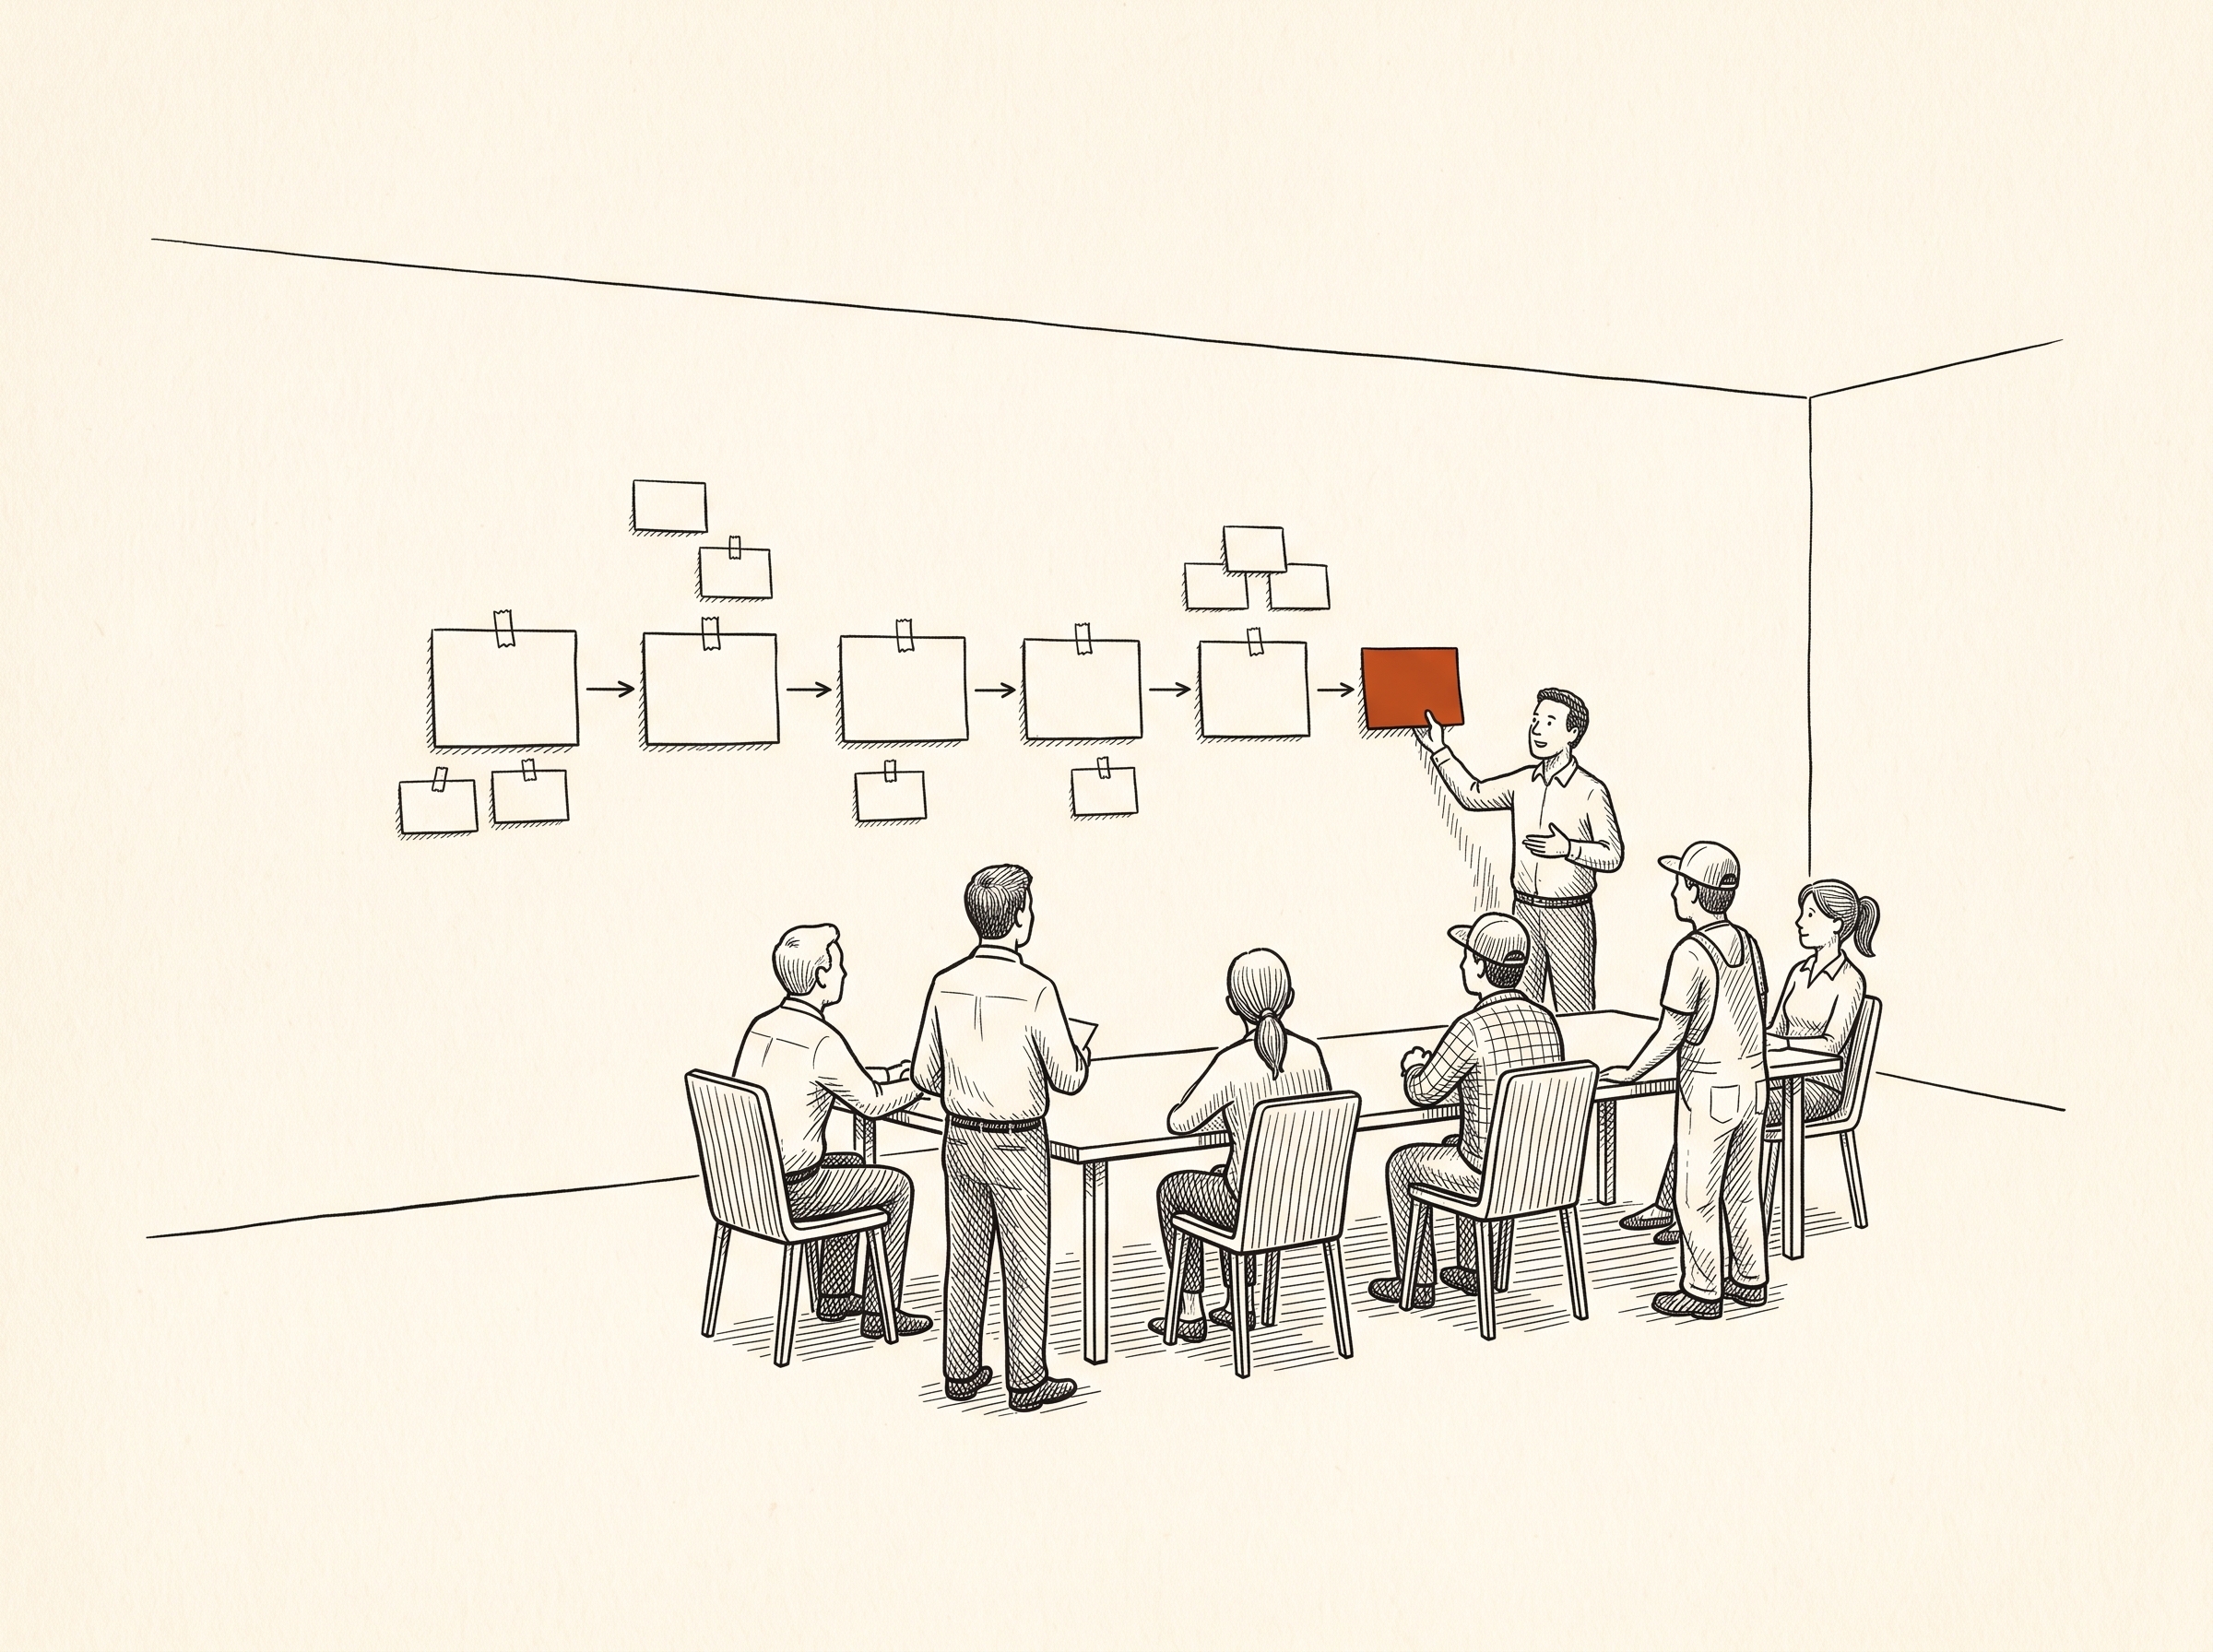
Map the steps
With planners, supervisors, and operators in the room, we lay out the five to ten major steps the work passes through, who feeds each one, who receives from it, and what enters and leaves. The map is agreed in the room, not drafted afterward.
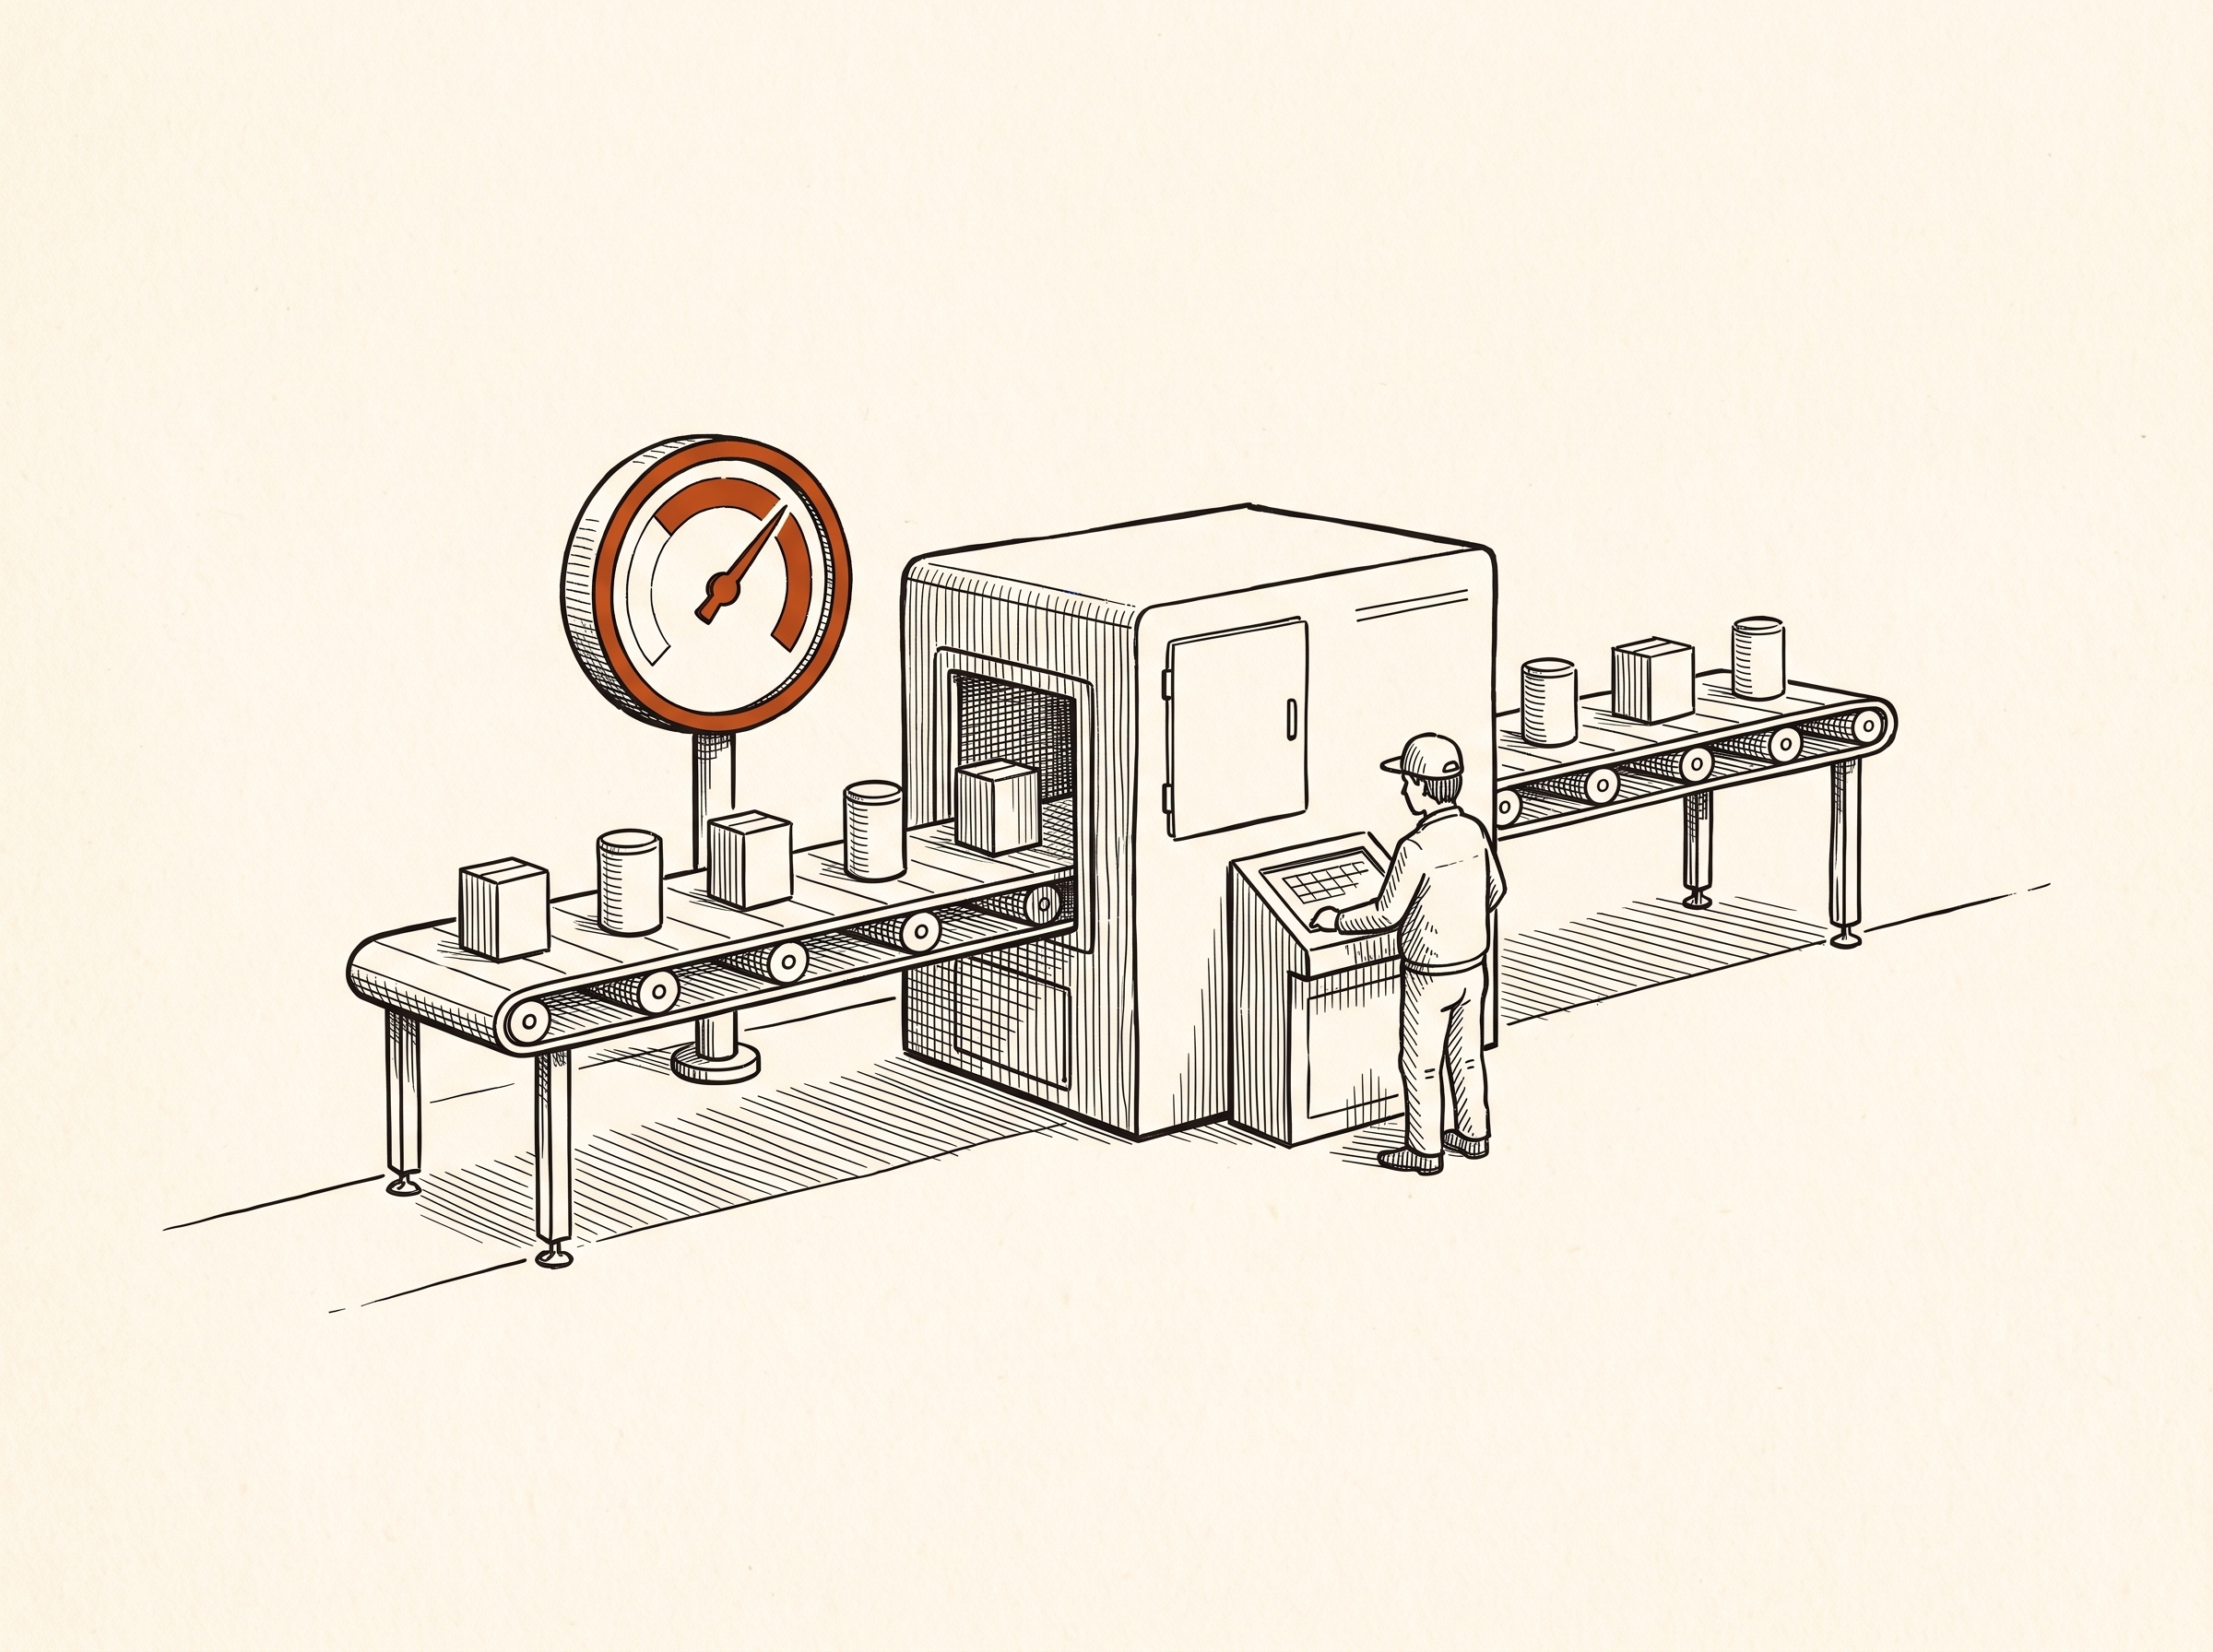
Define what has to go right
For each step, the question is simple: how do you know it went well, and what has to be true for the work to stay on schedule? The answers become the measures that predict trouble before the lagging number reports it.
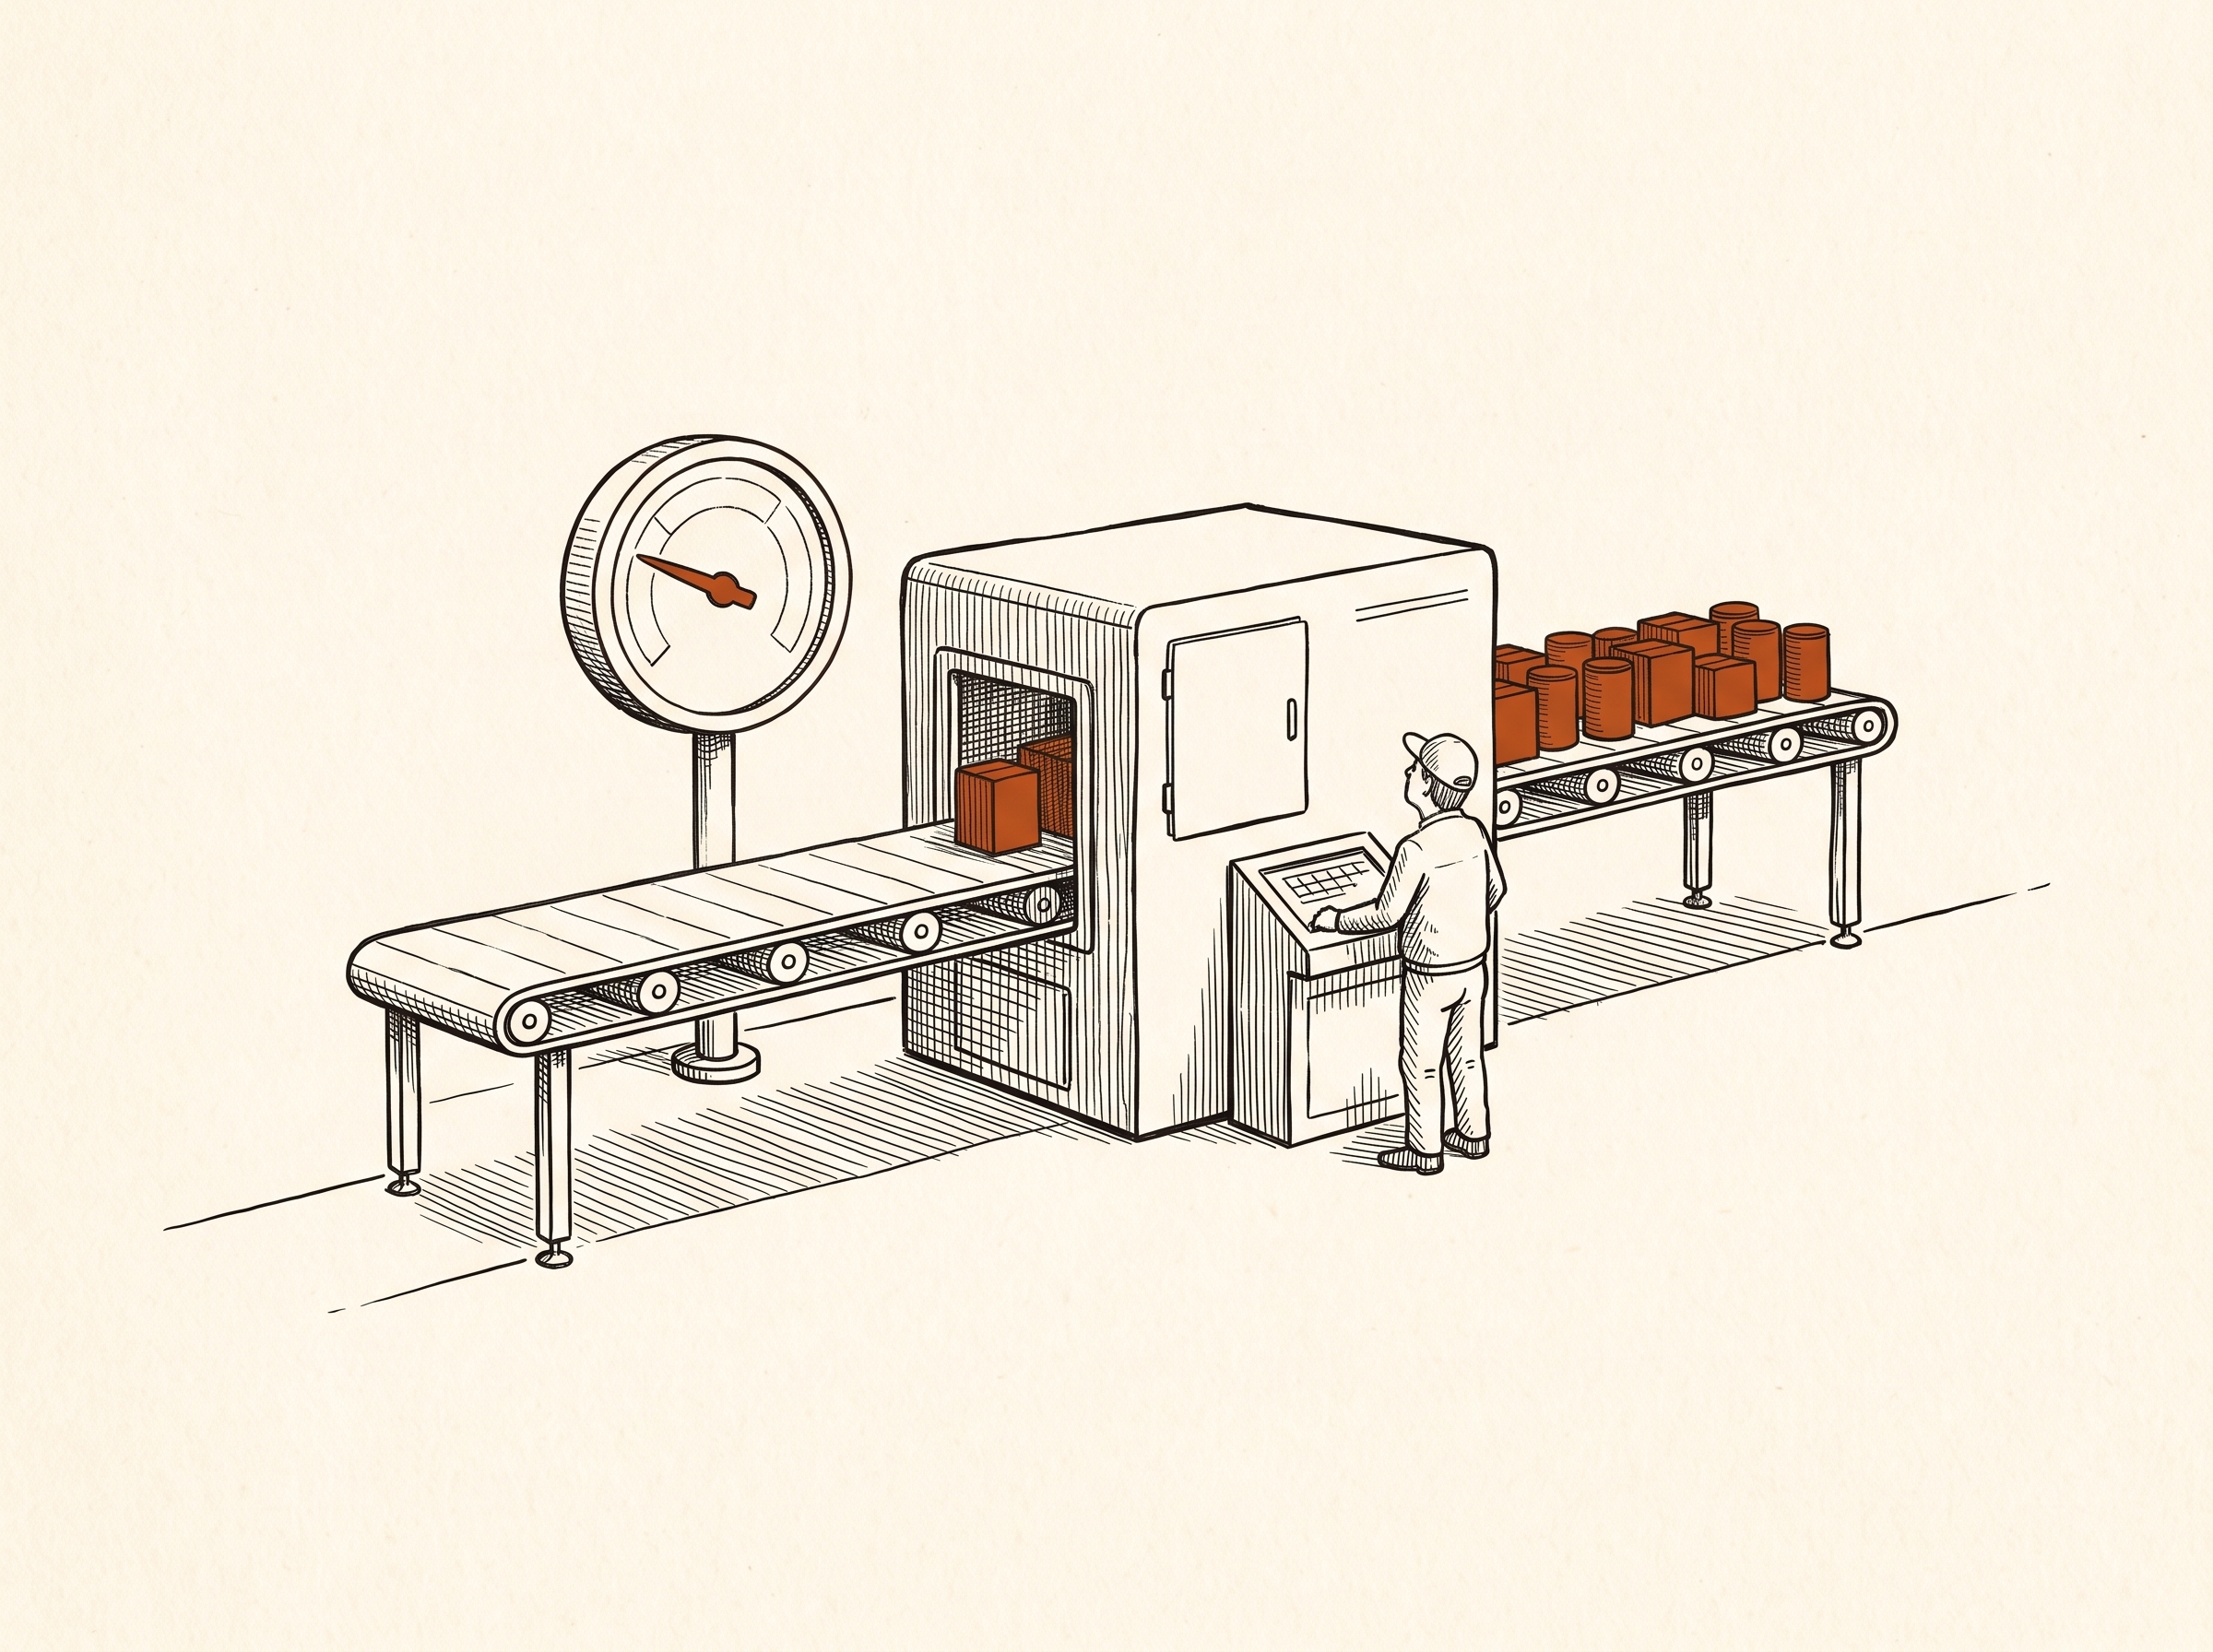
Flip each one
Every measure gets turned over. What happens when it is late, missing, or wrong? Who notices, and how long after? That list, built by your own people, is the raw material for everything that follows.
What you walk away with
The problem matrix, and everything behind it
Every problem from the site days, placed by how much it costs you and how much it takes to fix. The matrix is the deliverable people put on the wall.
Process map
The operation as it runs, agreed by the people who run it.
What has to go right
The measures at each step, with definitions, thresholds, and where the data for each one lives.
Data readiness
Which measures your systems supply today, which are partial, and which need a collection change before anyone should trust them. It also names where numbers get adjusted by hand before anyone uses them, and which of today's rules are backed by data and which are habit.
Impact estimates
A cost on each problem, agreed with your team, so the ranking holds up in front of finance.
Next-step scope, if you want it
A fixed price and schedule for the first item in the "worth modeling" quadrant.
Yours either way
The map works with us or without us.
The quick wins are yours
Most of what lands in the matrix does not need a model. It needs a decision someone was avoiding, a collection change in the ERP, or a rule the second shift never got told about. Those are yours, and you can start on them the week we leave.
The hard ones come with a case
The items that do need a model arrive with a business case already built: the cost of the problem, the effort to fix it, and a fixed-price scope to fix it. When that is the right next step, you are not buying a study to find out whether it is. When it is not, you still have the plan.
Where it leads
Three ways forward, and none of them is required.
Answer it once
You take the first "worth modeling" item and we build the decision system for it, at the price in the plan.
Scoped projects→ Licensing and trainingBuild it in-house
Your team builds it, with our tools and our people beside them.
Licensing and training→ Managed servicesKeep it current
The problem returns every cycle, so we keep the model current alongside your team.
Managed services→Common questions
Common questions before you commit
What do we need to provide?
Two days of availability from planning, operations management, and two or three people who run the floor, plus one person each from finance and IT for the cost numbers and the data access. A representative data extract. One person who owns the decision and can sign off on the map.
Our data is a mess. Does that stop it?
No. The data assessment is one of the deliverables, so messy data is an input, not a blocker. You find out exactly which measures your systems can support today and which need a change first, before anyone builds on them.
We have tried this before. Why would it hold this time?
Most past attempts started with a solution and worked backward. The workshop starts with the list, built and ranked by your own people, so the plan you present is one your team already agreed to.
What if we do not hire you afterward?
You keep everything: the map, the measures, the data assessment, and the matrix. The quick wins are yours to run. The plan for the harder items is in your hands. Nothing in it depends on SimWell to be useful.
Can we skip it and go straight to a project?
Yes, if you already know the decision. A scoped project handles its own discovery. The workshop is for when the problem is clear and the fix is not.
Get started
Bring the metric that will not move.
Two weeks from now you can have the list, ranked, with a cost on each line and your team's name on it. If the workshop is not the right way in, you will hear that on the first call.